Note
Go to the end to download the full example code.
Estimate threshold exceedance iteratively
In this example, we use the IterativeThresholdExceedance
class to count the number of threshold exceedances.
import openturns as ot
import openturns.viewer as otv
We first create a one-dimensional Gaussian random variable to generate data.
dim = 1
distNormal = ot.Normal(dim)
Let us consider a threshold value of 1.0. Each data value higher than 1.0 is
counted as one exceedance. The counter used by the
IterativeThresholdExceedance class is updated iteratively.
threshold = 1.0
algo = ot.IterativeThresholdExceedance(dim, ot.Greater(), threshold)
A simple computation shows that the probability of the data being higher than is
(with 4 significant digits).
distribution = ot.Normal()
exactProbability = distribution.computeComplementaryCDF(threshold)
print("Exact probability: ", exactProbability)
Exact probability: 0.15865525393145702
We can now perform the simulations. In our case most of the data fall below the specified threshold value so the number of exceedances should be low.
We first increment the object one Point at a time.
At any given step the current number of exceedance is obtained with
the getThresholdExceedance() method.
size = 5000
exceedanceNumbers = ot.Sample()
probabilityEstimateSample = ot.Sample()
for i in range(size):
    point = distNormal.getRealization()
    algo.increment(point)
    numberOfExceedances = algo.getThresholdExceedance()[0]
    exceedanceNumbers.add([numberOfExceedances])
    probabilityEstimate = numberOfExceedances / algo.getIterationNumber()
    probabilityEstimateSample.add([probabilityEstimate])
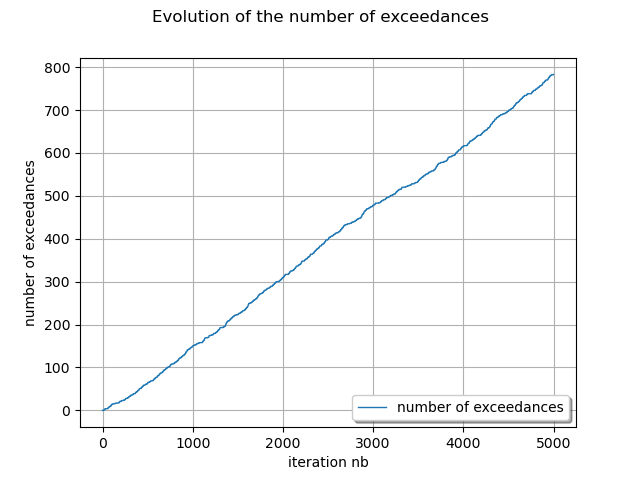
We display the evolution of the number of exceedances.
curve = ot.Curve(exceedanceNumbers)
curve.setLegend("number of exceedance")
#
graph = ot.Graph(
    "Evolution of the number of exceedances",
    "iteration nb",
    "number of exceedances",
    True,
)
graph.add(curve)
graph.setLegends(["number of exceedances"])
graph.setLegendPosition("lower right")
view = otv.View(graph)

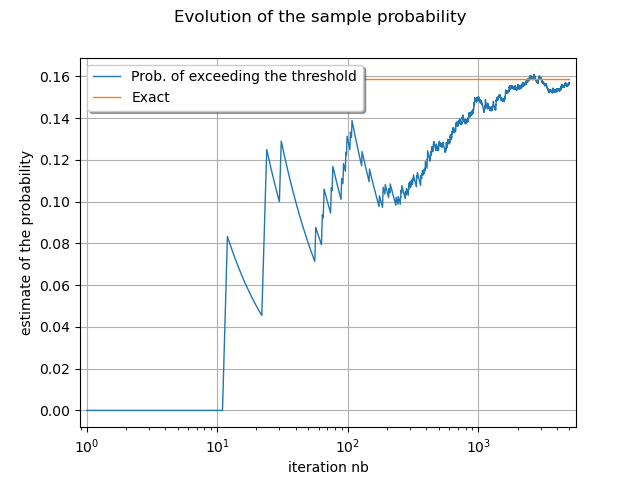
The following plot shows that the probability of exceeding the threshold converges.
iterationSample = ot.Sample.BuildFromPoint(range(1, size + 1))
curve = ot.Curve(iterationSample, probabilityEstimateSample)
curve.setLegend("Prob. of exceeding the threshold")
#
exactCurve = ot.Curve([1, size], [exactProbability, exactProbability])
exactCurve.setLegend("Exact")
#
graph = ot.Graph(
    "Evolution of the sample probability",
    "iteration nb",
    "estimate of the probability",
    True,
)
graph.add(curve)
graph.add(exactCurve)
graph.setLegendPosition("upper left")
graph.setLogScale(ot.GraphImplementation.LOGX)
view = otv.View(graph)

We can also increment with a Sample.
sample = distNormal.getSample(size)
algo.increment(sample)
numberOfExceedances = algo.getThresholdExceedance()[0]
print("Number of exceedance: ", numberOfExceedances)

# The empirical probability is close to the exact value.
numberOfExceedances = algo.getThresholdExceedance()[0]
probabilityEstimate = numberOfExceedances / algo.getIterationNumber()
print("Empirical exceedance prb: ", probabilityEstimate)

otv.View.ShowAll()
Number of exceedance:  1579.0
Empirical exceedance prb:  0.1579
 OpenTURNS