Note
Go to the end to download the full example code.
Estimate a buckling probability
In this example, we estimate the probability that the output of a function exceeds a given threshold with the FORM method, the SORM method and an advanced sampling method.
We consider the stiffened panel model.
Define the model
from openturns.usecases import stiffened_panel
import openturns as ot
import openturns.viewer as viewer

ot.Log.Show(ot.Log.NONE)
We load the stiffened panel model from the usecases module :
panel = stiffened_panel.StiffenedPanel()
distribution = panel.distribution
model = panel.model
See the input distribution
distribution
See the model
model.getOutputDescription()
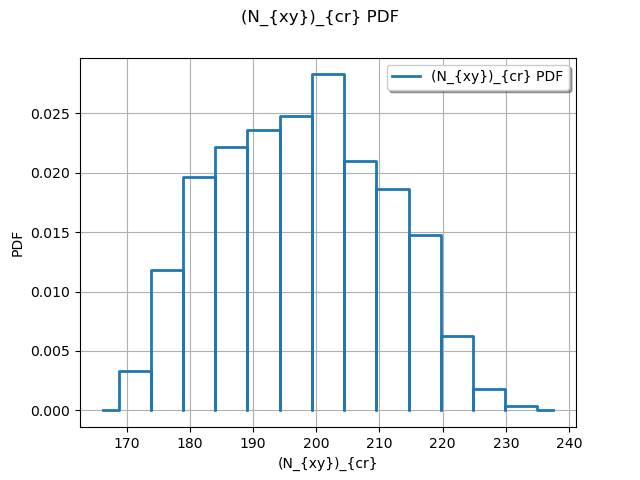
Draw the distribution of a sample of the output.
sampleSize = 1000
inputSample = distribution.getSample(sampleSize)
outputSample = model(inputSample)
graph = ot.HistogramFactory().build(outputSample).drawPDF()
_ = viewer.View(graph)

Define the event
Then we create the event whose probability we want to estimate.
vect = ot.RandomVector(distribution)
criticalLoad = ot.CompositeRandomVector(model, vect)
minimumCriticalLoad = 165.0
event = ot.ThresholdEvent(criticalLoad, ot.Less(), minimumCriticalLoad)
event.setName("buckling")
Estimate the probability with FORM
Define a solver.
optimAlgo = ot.Cobyla()
optimAlgo.setMaximumCallsNumber(1000)
optimAlgo.setMaximumAbsoluteError(1.0e-10)
optimAlgo.setMaximumRelativeError(1.0e-10)
optimAlgo.setMaximumResidualError(1.0e-10)
optimAlgo.setMaximumConstraintError(1.0e-10)
Run FORM.
startingPoint = distribution.getMean()
algo = ot.FORM(optimAlgo, event, startingPoint)
n0 = model.getCallsNumber()
algo.run()
n1 = model.getCallsNumber()
result = algo.getResult()
standardSpaceDesignPoint = result.getStandardSpaceDesignPoint()
Retrieve results.
result = algo.getResult()
probability = result.getEventProbability()
print("Pf (FORM)=%.3e" % probability, "nb evals=", n1 - n0)
Pf (FORM)=7.620e-04 nb evals= 1
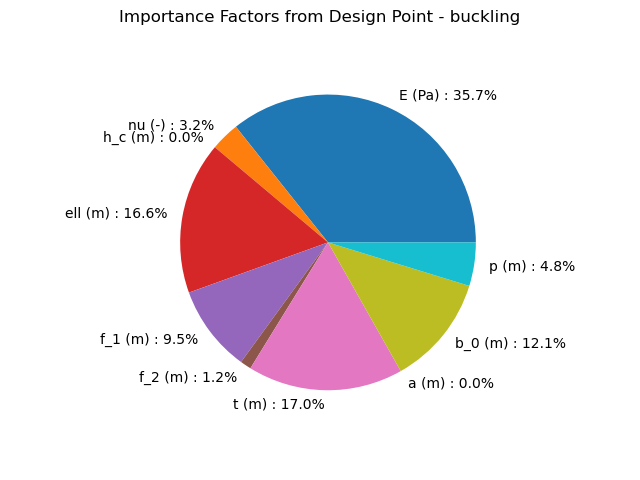
Importance factors.
graph = result.drawImportanceFactors()
view = viewer.View(graph)

Estimate the probability with SORM
Run SORM.
algo = ot.SORM(optimAlgo, event, startingPoint)
n0 = model.getCallsNumber()
algo.run()
n1 = model.getCallsNumber()
Retrieve results.
result = algo.getResult()
probability = result.getEventProbabilityBreitung()
print("Pf (SORM)=%.3e" % probability, "nb evals=", n1 - n0)
Pf (SORM)=7.027e-05 nb evals= 1
We see that the FORM and SORM approximations give significantly different results. Use a simulation algorithm to get a confidence interval.
Estimate the probability with PostAnalyticalControlledImportanceSampling
algo = ot.PostAnalyticalControlledImportanceSampling(result)
algo.setBlockSize(100)
algo.setMaximumOuterSampling(100)
algo.setMaximumCoefficientOfVariation(0.1)
n0 = model.getCallsNumber()
algo.run()
n1 = model.getCallsNumber()
result = algo.getResult()
Pf = result.getProbabilityEstimate()
print("Pf (sim) = %.3e" % Pf, "nb evals=", n1 - n0)
width = result.getConfidenceLength(0.95)
print("C.I (95%)=[" + "%.3e" % (Pf - 0.5 * width), ",%.3e" % (Pf + 0.5 * width), "]")
Pf (sim) = 5.822e-05 nb evals= 0
C.I (95%)=[2.973e-05 ,8.670e-05 ]
 OpenTURNS