Graphical goodness-of-fit tests
We gather some graphical tools to validate whether a given sample of data is drawn from a given continuous distribution of dimension 1.
We denote by  the data of dimension 1
which have been independently generated by the random variable
the data of dimension 1
which have been independently generated by the random variable  .
Let
.
Let  be a continuous cumulative distribution function.
We want to validate whether follows the distribution characterized by .
QQ-plot
The Quantile - Quantile - Plot (QQ Plot) is based on the comparison of some quantiles
between the tested distribution and the empirical ones. Let  be the quantile of order
 of the distribution , with
  . It is defined by:

The empirical quantile of order built on the sample is defined by:
![\begin{aligned}
\widehat{q}_{X}(\alpha) = x_{([\sampleSize \alpha]+1)}
\end{aligned}](data:image/svg+xml;base64,PD94bWwgdmVyc2lvbj0nMS4wJyBlbmNvZGluZz0nVVRGLTgnPz4KPCEtLSBUaGlzIGZpbGUgd2FzIGdlbmVyYXRlZCBieSBkdmlzdmdtIDMuNC4yIC0tPgo8c3ZnIHZlcnNpb249JzEuMScgeG1sbnM9J2h0dHA6Ly93d3cudzMub3JnLzIwMDAvc3ZnJyB4bWxuczp4bGluaz0naHR0cDovL3d3dy53My5vcmcvMTk5OS94bGluaycgd2lkdGg9Jzg0Ljk4OTAxOXB0JyBoZWlnaHQ9JzEyLjgxODYxNHB0JyB2aWV3Qm94PScxNTEuNTI3OTAxIC0xMy40NDk2NzEgODQuOTg5MDE5IDEyLjgxODYxNCc+CjxkZWZzPgo8cGF0aCBpZD0nZzQtNDAnIGQ9J00zLjg4NTQzIDIuOTA1MTA2QzMuODg1NDMgMi44NjkyNCAzLjg4NTQzIDIuODQ1MzMgMy42ODIxOTIgMi42NDIwOTJDMi40ODY2NzUgMS40MzQ2MiAxLjgxNzE4Ni0uNTM3OTgzIDEuODE3MTg2LTIuOTc2ODM3QzEuODE3MTg2LTUuMjk2MTM5IDIuMzc5MDc4LTcuMjkyNjUzIDMuNzY1ODc4LTguNzAzMzYyQzMuODg1NDMtOC44MTA5NTkgMy44ODU0My04LjgzNDg2OSAzLjg4NTQzLTguODcwNzM1QzMuODg1NDMtOC45NDI0NjYgMy44MjU2NTQtOC45NjYzNzYgMy43Nzc4MzMtOC45NjYzNzZDMy42MjI0MTYtOC45NjYzNzYgMi42NDIwOTItOC4xMDU2MDQgMi4wNTYyODktNi45MzM5OThDMS40NDY1NzUtNS43MjY1MjYgMS4xNzE2MDYtNC40NDczMjMgMS4xNzE2MDYtMi45NzY4MzdDMS4xNzE2MDYtMS45MTI4MjcgMS4zMzg5NzktLjQ5MDE2MiAxLjk2MDY0OCAuNzg5MDQxQzIuNjY2MDAyIDIuMjIzNjYxIDMuNjQ2MzI2IDMuMDAwNzQ3IDMuNzc3ODMzIDMuMDAwNzQ3QzMuODI1NjU0IDMuMDAwNzQ3IDMuODg1NDMgMi45NzY4MzcgMy44ODU0MyAyLjkwNTEwNlonLz4KPHBhdGggaWQ9J2c0LTQxJyBkPSdNMy4zNzEzNTctMi45NzY4MzdDMy4zNzEzNTctMy44ODU0MyAzLjI1MTgwNi01LjM2Nzg3IDIuNTgyMzE2LTYuNzU0NjdDMS44NzY5NjEtOC4xODkyOSAuODk2NjM4LTguOTY2Mzc2IC43NjUxMzEtOC45NjYzNzZDLjcxNzMxLTguOTY2Mzc2IC42NTc1MzQtOC45NDI0NjYgLjY1NzUzNC04Ljg3MDczNUMuNjU3NTM0LTguODM0ODY5IC42NTc1MzQtOC44MTA5NTkgLjg2MDc3Mi04LjYwNzcyMUMyLjA1NjI4OS03LjQwMDI0OSAyLjcyNTc3OC01LjQyNzY0NiAyLjcyNTc3OC0yLjk4ODc5MkMyLjcyNTc3OC0uNjY5NDg5IDIuMTYzODg1IDEuMzI3MDI0IC43NzcwODYgMi43Mzc3MzNDLjY1NzUzNCAyLjg0NTMzIC42NTc1MzQgMi44NjkyNCAuNjU3NTM0IDIuOTA1MTA2Qy42NTc1MzQgMi45NzY4MzcgLjcxNzMxIDMuMDAwNzQ3IC43NjUxMzEgMy4wMDA3NDdDLjkyMDU0OCAzLjAwMDc0NyAxLjkwMDg3MiAyLjEzOTk3NSAyLjQ4NjY3NSAuOTY4MzY5QzMuMDk2Mzg5LS4yNTEwNTkgMy4zNzEzNTctMS41NDIyMTcgMy4zNzEzNTctMi45NzY4MzdaJy8+CjxwYXRoIGlkPSdnNC02MScgZD0nTTguMDY5NzM4LTMuODczNDc0QzguMjM3MTExLTMuODczNDc0IDguNDUyMzA0LTMuODczNDc0IDguNDUyMzA0LTQuMDg4NjY3QzguNDUyMzA0LTQuMzE1ODE2IDguMjQ5MDY2LTQuMzE1ODE2IDguMDY5NzM4LTQuMzE1ODE2SDEuMDI4MTQ0Qy44NjA3NzItNC4zMTU4MTYgLjY0NTU3OS00LjMxNTgxNiAuNjQ1NTc5LTQuMTAwNjIzQy42NDU1NzktMy44NzM0NzQgLjg0ODgxNy0zLjg3MzQ3NCAxLjAyODE0NC0zLjg3MzQ3NEg4LjA2OTczOFpNOC4wNjk3MzgtMS42NDk4MTNDOC4yMzcxMTEtMS42NDk4MTMgOC40NTIzMDQtMS42NDk4MTMgOC40NTIzMDQtMS44NjUwMDZDOC40NTIzMDQtMi4wOTIxNTQgOC4yNDkwNjYtMi4wOTIxNTQgOC4wNjk3MzgtMi4wOTIxNTRIMS4wMjgxNDRDLjg2MDc3Mi0yLjA5MjE1NCAuNjQ1NTc5LTIuMDkyMTU0IC42NDU1NzktMS44NzY5NjFDLjY0NTU3OS0xLjY0OTgxMyAuODQ4ODE3LTEuNjQ5ODEzIDEuMDI4MTQ0LTEuNjQ5ODEzSDguMDY5NzM4WicvPgo8cGF0aCBpZD0nZzEtMTEnIGQ9J000LjA2NDc1Ny0xLjExNTgxNkM0LjgwNTk3OC0xLjkyODc2NyA1LjA2ODk5MS0yLjk2NDg4MiA1LjA2ODk5MS0zLjAyODY0M0M1LjA2ODk5MS0zLjEwMDM3NCA1LjAyMTE3MS0zLjEzMjI1NCA0Ljk0OTQ0LTMuMTMyMjU0QzQuODQ1ODI4LTMuMTMyMjU0IDQuODM3ODU4LTMuMTAwMzc0IDQuNzkwMDM3LTIuOTMzMDAxQzQuNTY2ODc0LTIuMTIwMDUgNC4wODg2NjctMS40OTgzODEgNC4wNjQ3NTctMS40OTgzODFDNC4wNDg4MTctMS40OTgzODEgNC4wNDg4MTctMS42OTc2MzQgNC4wNDg4MTctMS44MjUxNTZDNC4wMzI4NzctMy4yMjc4OTUgMy4xMjQyODQtMy41MTQ4MTkgMi41ODIzMTYtMy41MTQ4MTlDMS40NTg1MzEtMy41MTQ4MTkgLjM1MDY4NS0yLjQyMjkxNCAuMzUwNjg1LTEuMjk5MTI4Qy4zNTA2ODUtLjUxMDA4NyAuOTAwNjIzIC4wNzk3MDEgMS43NDU0NTUgLjA3OTcwMUMyLjMwMzM2MiAuMDc5NzAxIDIuODkzMTUxLS4xMTk1NTIgMy41MjI3OS0uNTg5Nzg4QzMuNjk4MTMyIC4wMzk4NTEgNC4xNjAzOTkgLjA3OTcwMSA0LjMwMzg2MSAuMDc5NzAxQzQuNzU4MTU3IC4wNzk3MDEgNS4wMjExNzEtLjMyNjc3NSA1LjAyMTE3MS0uNDc4MjA3QzUuMDIxMTcxLS41NzM4NDggNC45MjU1MjktLjU3Mzg0OCA0LjkwMTYxOS0uNTczODQ4QzQuODEzOTQ4LS41NzM4NDggNC43OTgwMDctLjU0OTkzOCA0Ljc3NDA5Ny0uNDk0MTQ3QzQuNjQ2NTc1LS4xNTk0MDIgNC4zNzU1OTItLjE0MzQ2MiA0LjMzNTc0MS0uMTQzNDYyQzQuMjI0MTU5LS4xNDM0NjIgNC4wOTY2MzgtLjE0MzQ2MiA0LjA2NDc1Ny0xLjExNTgxNlpNMy40NjY5OTktLjg1MjgwMkMyLjkwMTEyMS0uMzQyNzE1IDIuMjMxNjMxLS4xNDM0NjIgMS43NjkzNjUtLjE0MzQ2MkMxLjM1NDkxOS0uMTQzNDYyIC45OTYyNjQtLjM4MjU2NSAuOTk2MjY0LTEuMDIwMTc0Qy45OTYyNjQtMS4yOTkxMjggMS4xMjM3ODYtMi4xMjAwNSAxLjQ5ODM4MS0yLjY1NDA0N0MxLjgxNzE4Ni0zLjEwMDM3NCAyLjI0NzU3Mi0zLjI5MTY1NiAyLjU3NDM0Ni0zLjI5MTY1NkMzLjAxMjcwMi0zLjI5MTY1NiAzLjI1OTc3Ni0yLjk4MDgyMiAzLjM2MzM4Ny0yLjQ5NDY0NUMzLjQ4MjkzOS0xLjk1MjY3NyAzLjQxOTE3OC0xLjMxNTA2OCAzLjQ2Njk5OS0uODUyODAyWicvPgo8cGF0aCBpZD0nZzEtODgnIGQ9J000LjE2MDM5OS0zLjA0NDU4M0M0LjU0Mjk2NC0zLjQzNTExOCA1LjY3NDcyLTQuNTk4NzU1IDUuODY2MDAyLTQuNzUwMTg3QzYuMjAwNzQ3LTUuMDA1MjMgNi40LTUuMTQ4NjkyIDYuOTczODQ4LTUuMTgwNTczQzcuMDIxNjY5LTUuMTg4NTQzIDcuMDg1NDMtNS4yMjgzOTQgNy4wODU0My01LjMzMjAwNUM3LjA4NTQzLTUuNDAzNzM2IDcuMDEzNjk5LTUuNDQzNTg3IDYuOTczODQ4LTUuNDQzNTg3QzYuODk0MTQ3LTUuNDQzNTg3IDYuODQ2MzI2LTUuNDE5Njc2IDYuMjI0NjU4LTUuNDE5Njc2QzUuNjI2ODk5LTUuNDE5Njc2IDUuNDExNzA2LTUuNDQzNTg3IDUuMzcxODU2LTUuNDQzNTg3QzUuMzM5OTc1LTUuNDQzNTg3IDUuMjEyNDUzLTUuNDQzNTg3IDUuMjEyNDUzLTUuMjkyMTU0QzUuMjEyNDUzLTUuMjg0MTg0IDUuMjEyNDUzLTUuMTg4NTQzIDUuMzMyMDA1LTUuMTgwNTczQzUuMzg3Nzk2LTUuMTcyNjAzIDUuNjAyOTg5LTUuMTU2NjYzIDUuNjAyOTg5LTQuOTczMzVDNS42MDI5ODktNC45MTc1NTkgNS41NzExMDgtNC44Mjk4ODggNS41MDczNDctNC43NjYxMjdMNS40ODM0MzctNC43MjYyNzZDNS40NTk1MjctNC43MDIzNjYgNS40NTk1MjctNC42ODY0MjYgNS4zNzk4MjYtNC42MTQ2OTVMNC4wNDg4MTctMy4yNjc3NDZMMy4yMzU4NjYtNC45NTc0MUMzLjM0NzQ0Ny01LjE0ODY5MiAzLjU4NjU1LTUuMTcyNjAzIDMuNjgyMTkyLTUuMTgwNTczQzMuNzIyMDQyLTUuMTgwNTczIDMuODMzNjI0LTUuMTg4NTQzIDMuODMzNjI0LTUuMzI0MDM1QzMuODMzNjI0LTUuMzk1NzY2IDMuNzc3ODMzLTUuNDQzNTg3IDMuNzA2MTAyLTUuNDQzNTg3QzMuNjI2NDAxLTUuNDQzNTg3IDMuMzIzNTM3LTUuNDI3NjQ2IDMuMjQzODM2LTUuNDI3NjQ2QzMuMTk2MDE1LTUuNDE5Njc2IDIuOTAxMTIxLTUuNDE5Njc2IDIuNzMzNzQ4LTUuNDE5Njc2QzEuOTkyNTI4LTUuNDE5Njc2IDEuODk2ODg3LTUuNDQzNTg3IDEuODI1MTU2LTUuNDQzNTg3QzEuNzkzMjc1LTUuNDQzNTg3IDEuNjY1NzUzLTUuNDQzNTg3IDEuNjY1NzUzLTUuMjkyMTU0QzEuNjY1NzUzLTUuMTgwNTczIDEuNzY5MzY1LTUuMTgwNTczIDEuODk2ODg3LTUuMTgwNTczQzIuMjk1MzkyLTUuMTgwNTczIDIuMzY3MTIzLTUuMTAwODcyIDIuNDM4ODU0LTQuOTQ5NDRMMy40OTg4NzktMi43MTc4MDhMMS44NjUwMDYtMS4wNTIwNTVDMS4zODY4LS41NzM4NDggMS4wMTIyMDQtLjI5NDg5NCAuNDQ2MzI2LS4yNjMwMTRDLjM1MDY4NS0uMjU1MDQ0IC4yNTUwNDQtLjI1NTA0NCAuMjU1MDQ0LS4xMTE1ODJDLjI1NTA0NC0uMDYzNzYxIC4yOTQ4OTQgMCAuMzc0NTk1IDBDLjQzMDM4NiAwIC41MTgwNTctLjAyMzkxIDEuMTIzNzg2LS4wMjM5MUMxLjY5NzYzNC0uMDIzOTEgMS45NDQ3MDcgMCAxLjk3NjU4OCAwQzIuMDE2NDM4IDAgMi4xMzU5OSAwIDIuMTM1OTktLjE1MTQzMkMyLjEzNTk5LS4xNjczNzIgMi4xMjgwMi0uMjU1MDQ0IDIuMDA4NDY4LS4yNjMwMTRDMS44NTcwMzYtLjI3MDk4NCAxLjc0NTQ1NS0uMzI2Nzc1IDEuNzQ1NDU1LS40NzAyMzdDMS43NDU0NTUtLjU5Nzc1OCAxLjg0MTA5Ni0uNzAxMzcgMS45NjA2NDgtLjgyMDkyMkMyLjA5NjEzOS0uOTcyMzU0IDIuNTEwNTg1LTEuMzg2OCAyLjc5NzUwOS0xLjY2NTc1M0MyLjk4MDgyMi0xLjg0OTA2NiAzLjQyNzE0OC0yLjMxMTMzMyAzLjYxMDQ2MS0yLjQ4NjY3NUw0LjUyNzAyNC0uNTgxODE4QzQuNTY2ODc0LS41MDIxMTcgNC41NjY4NzQtLjQ5NDE0NyA0LjU2Njg3NC0uNDg2MTc3QzQuNTY2ODc0LS40MTQ0NDYgNC4zOTk1MDItLjI3ODk1NCA0LjEzNjQ4OC0uMjYzMDE0QzQuMDgwNjk3LS4yNjMwMTQgMy45NzcwODYtLjI1NTA0NCAzLjk3NzA4Ni0uMTExNTgyQzMuOTc3MDg2LS4xMDM2MTEgMy45ODUwNTYgMCA0LjExMjU3OCAwQzQuMTkyMjc5IDAgNC40ODcxNzMtLjAxNTk0IDQuNTY2ODc0LS4wMjM5MUg1LjA3Njk2MUM1LjgxMDIxMi0uMDIzOTEgNS45MjE3OTMgMCA1Ljk5MzUyNCAwQzYuMDI1NDA1IDAgNi4xNDQ5NTYgMCA2LjE0NDk1Ni0uMTUxNDMyQzYuMTQ0OTU2LS4yNjMwMTQgNi4wNDEzNDUtLjI2MzAxNCA1LjkyMTc5My0uMjYzMDE0QzUuNDkxNDA3LS4yNjMwMTQgNS40NDM1ODctLjM1ODY1NSA1LjM4Nzc5Ni0uNDc4MjA3TDQuMTYwMzk5LTMuMDQ0NTgzWicvPgo8cGF0aCBpZD0nZzEtMTEwJyBkPSdNMS41OTQwMjItMS4zMDcwOThDMS42MTc5MzMtMS40MjY2NSAxLjY5NzYzNC0xLjcyOTUxNCAxLjcyMTU0NC0xLjg0OTA2NkMxLjgzMzEyNi0yLjI3OTQ1MiAxLjgzMzEyNi0yLjI4NzQyMiAyLjAxNjQzOC0yLjU1MDQzNkMyLjI3OTQ1Mi0yLjk0MDk3MSAyLjY1NDA0Ny0zLjI5MTY1NiAzLjE4ODA0NS0zLjI5MTY1NkMzLjQ3NDk2OS0zLjI5MTY1NiAzLjY0MjM0MS0zLjEyNDI4NCAzLjY0MjM0MS0yLjc0OTY4OUMzLjY0MjM0MS0yLjMxMTMzMyAzLjMwNzU5Ny0xLjQwMjc0IDMuMTU2MTY0LTEuMDEyMjA0QzMuMDUyNTUzLS43NDkxOTEgMy4wNTI1NTMtLjcwMTM3IDMuMDUyNTUzLS41OTc3NThDMy4wNTI1NTMtLjE0MzQ2MiAzLjQyNzE0OCAuMDc5NzAxIDMuNzY5ODYzIC4wNzk3MDFDNC41NTA5MzQgLjA3OTcwMSA0Ljg3NzcwOS0xLjAzNjExNSA0Ljg3NzcwOS0xLjEzOTcyNkM0Ljg3NzcwOS0xLjIxOTQyNyA0LjgxMzk0OC0xLjI0MzMzNyA0Ljc1ODE1Ny0xLjI0MzMzN0M0LjY2MjUxNi0xLjI0MzMzNyA0LjY0NjU3NS0xLjE4NzU0NyA0LjYyMjY2NS0xLjEwNzg0NkM0LjQzMTM4Mi0uNDU0Mjk2IDQuMDk2NjM4LS4xNDM0NjIgMy43OTM3NzMtLjE0MzQ2MkMzLjY2NjI1Mi0uMTQzNDYyIDMuNjAyNDkxLS4yMjMxNjMgMy42MDI0OTEtLjQwNjQ3NlMzLjY2NjI1Mi0uNzY1MTMxIDMuNzQ1OTUzLS45NjQzODRDMy44NjU1MDQtMS4yNjcyNDggNC4yMTYxODktMi4xODM4MTEgNC4yMTYxODktMi42MzAxMzdDNC4yMTYxODktMy4yMjc4OTUgMy44MDE3NDMtMy41MTQ4MTkgMy4yMjc4OTUtMy41MTQ4MTlDMi41ODIzMTYtMy41MTQ4MTkgMi4xNjc4Ny0zLjEyNDI4NCAxLjkzNjczNy0yLjgyMTQyQzEuODgwOTQ2LTMuMjU5Nzc2IDEuNTMwMjYyLTMuNTE0ODE5IDEuMTIzNzg2LTMuNTE0ODE5Qy44MzY4NjItMy41MTQ4MTkgLjYzNzYwOS0zLjMzMTUwNyAuNTEwMDg3LTMuMDg0NDMzQy4zMTg4MDQtMi43MDk4MzggLjIzOTEwMy0yLjMxMTMzMyAuMjM5MTAzLTIuMjk1MzkyQy4yMzkxMDMtMi4yMjM2NjEgLjI5NDg5NC0yLjE5MTc4MSAuMzU4NjU1LTIuMTkxNzgxQy40NjIyNjctMi4xOTE3ODEgLjQ3MDIzNy0yLjIyMzY2MSAuNTI2MDI3LTIuNDMwODg0Qy42MjE2NjktMi44MjE0MiAuNzY1MTMxLTMuMjkxNjU2IDEuMDk5ODc1LTMuMjkxNjU2QzEuMzA3MDk4LTMuMjkxNjU2IDEuMzU0OTE5LTMuMDkyNDAzIDEuMzU0OTE5LTIuOTE3MDYxQzEuMzU0OTE5LTIuNzczNTk5IDEuMzE1MDY4LTIuNjIyMTY3IDEuMjUxMzA4LTIuMzU5MTUzQzEuMjM1MzY3LTIuMjk1MzkyIDEuMTE1ODE2LTEuODI1MTU2IDEuMDgzOTM1LTEuNzEzNTc0TC43ODkwNDEtLjUxODA1N0MuNzU3MTYxLS4zOTg1MDYgLjcwOTM0LS4xOTkyNTMgLjcwOTM0LS4xNjczNzJDLjcwOTM0IC4wMTU5NCAuODYwNzcyIC4wNzk3MDEgLjk2NDM4NCAuMDc5NzAxQzEuMTA3ODQ2IC4wNzk3MDEgMS4yMjczOTctLjAxNTk0IDEuMjgzMTg4LS4xMTE1ODJDMS4zMDcwOTgtLjE1OTQwMiAxLjM3MDg1OS0uNDMwMzg2IDEuNDEwNzEtLjU5Nzc1OEwxLjU5NDAyMi0xLjMwNzA5OFonLz4KPHBhdGggaWQ9J2czLTQwJyBkPSdNMi42NTQwNDcgMS45OTI1MjhDMi43MTc4MDggMS45OTI1MjggMi44MTM0NSAxLjk5MjUyOCAyLjgxMzQ1IDEuODk2ODg3QzIuODEzNDUgMS44NjUwMDYgMi44MDU0NzkgMS44NTcwMzYgMi43MDE4NjggMS43NTM0MjVDMS42MDk5NjMgLjcyNTI4IDEuMzM4OTc5LS43NTcxNjEgMS4zMzg5NzktMS45OTI1MjhDMS4zMzg5NzktNC4yODc5MiAyLjI4NzQyMi01LjM2Mzg4NSAyLjY5Mzg5OC01LjczMDUxMUMyLjgwNTQ3OS01LjgzNDEyMiAyLjgxMzQ1LTUuODQyMDkyIDIuODEzNDUtNS44ODE5NDNTMi43ODE1NjktNS45Nzc1ODQgMi43MDE4NjgtNS45Nzc1ODRDMi41NzQzNDYtNS45Nzc1ODQgMi4xNzU4NDEtNS41NzExMDggMi4xMTIwOC01LjQ5OTM3N0MxLjA0NDA4NS00LjM4MzU2MiAuODIwOTIyLTIuOTQ4OTQxIC44MjA5MjItMS45OTI1MjhDLjgyMDkyMi0uMjA3MjIzIDEuNTcwMTEyIDEuMjI3Mzk3IDIuNjU0MDQ3IDEuOTkyNTI4WicvPgo8cGF0aCBpZD0nZzMtNDEnIGQ9J00yLjQ2Mjc2NS0xLjk5MjUyOEMyLjQ2Mjc2NS0yLjc0OTY4OSAyLjMzNTI0My0zLjY1ODI4MSAxLjg0MTA5Ni00LjU5ODc1NUMxLjQ1MDU2LTUuMzMyMDA1IC43MjUyOC01Ljk3NzU4NCAuNTgxODE4LTUuOTc3NTg0Qy41MDIxMTctNS45Nzc1ODQgLjQ3ODIwNy01LjkyMTc5MyAuNDc4MjA3LTUuODgxOTQzQy40NzgyMDctNS44NTAwNjIgLjQ3ODIwNy01LjgzNDEyMiAuNTczODQ4LTUuNzM4NDgxQzEuNjg5NjY0LTQuNjc4NDU2IDEuOTQ0NzA3LTMuMjE5OTI1IDEuOTQ0NzA3LTEuOTkyNTI4QzEuOTQ0NzA3IC4yOTQ4OTQgLjk5NjI2NCAxLjM3ODgyOSAuNTg5Nzg4IDEuNzQ1NDU1Qy40ODYxNzcgMS44NDkwNjYgLjQ3ODIwNyAxLjg1NzAzNiAuNDc4MjA3IDEuODk2ODg3Uy41MDIxMTcgMS45OTI1MjggLjU4MTgxOCAxLjk5MjUyOEMuNzA5MzQgMS45OTI1MjggMS4xMDc4NDYgMS41ODYwNTIgMS4xNzE2MDYgMS41MTQzMjFDMi4yMzk2MDEgLjM5ODUwNiAyLjQ2Mjc2NS0xLjAzNjExNSAyLjQ2Mjc2NS0xLjk5MjUyOFonLz4KPHBhdGggaWQ9J2czLTQzJyBkPSdNMy40NzQ5NjktMS44MDkyMTVINS44MTgxODJDNS45Mjk3NjMtMS44MDkyMTUgNi4xMDUxMDYtMS44MDkyMTUgNi4xMDUxMDYtMS45OTI1MjhTNS45Mjk3NjMtMi4xNzU4NDEgNS44MTgxODItMi4xNzU4NDFIMy40NzQ5NjlWLTQuNTI3MDI0QzMuNDc0OTY5LTQuNjM4NjA1IDMuNDc0OTY5LTQuODEzOTQ4IDMuMjkxNjU2LTQuODEzOTQ4UzMuMTA4MzQ0LTQuNjM4NjA1IDMuMTA4MzQ0LTQuNTI3MDI0Vi0yLjE3NTg0MUguNzU3MTYxQy42NDU1NzktMi4xNzU4NDEgLjQ3MDIzNy0yLjE3NTg0MSAuNDcwMjM3LTEuOTkyNTI4Uy42NDU1NzktMS44MDkyMTUgLjc1NzE2MS0xLjgwOTIxNUgzLjEwODM0NFYuNTQxOTY4QzMuMTA4MzQ0IC42NTM1NDkgMy4xMDgzNDQgLjgyODg5MiAzLjI5MTY1NiAuODI4ODkyUzMuNDc0OTY5IC42NTM1NDkgMy40NzQ5NjkgLjU0MTk2OFYtMS44MDkyMTVaJy8+CjxwYXRoIGlkPSdnMy00OScgZD0nTTIuNTAyNjE1LTUuMDc2OTYxQzIuNTAyNjE1LTUuMjkyMTU0IDIuNDg2Njc1LTUuMzAwMTI1IDIuMjcxNDgyLTUuMzAwMTI1QzEuOTQ0NzA3LTQuOTgxMzIgMS41MjIyOTEtNC43OTAwMzcgLjc2NTEzMS00Ljc5MDAzN1YtNC41MjcwMjRDLjk4MDMyNC00LjUyNzAyNCAxLjQxMDcxLTQuNTI3MDI0IDEuODcyOTc2LTQuNzQyMjE3Vi0uNjUzNTQ5QzEuODcyOTc2LS4zNTg2NTUgMS44NDkwNjYtLjI2MzAxNCAxLjA5MTkwNS0uMjYzMDE0SC44MTI5NTFWMEMxLjEzOTcyNi0uMDIzOTEgMS44MjUxNTYtLjAyMzkxIDIuMTgzODExLS4wMjM5MVMzLjIzNTg2Ni0uMDIzOTEgMy41NjI2NCAwVi0uMjYzMDE0SDMuMjgzNjg2QzIuNTI2NTI2LS4yNjMwMTQgMi41MDI2MTUtLjM1ODY1NSAyLjUwMjYxNS0uNjUzNTQ5Vi01LjA3Njk2MVonLz4KPHBhdGggaWQ9J2czLTkxJyBkPSdNMi4xNTk5IDEuOTkyNTI4VjEuNjI1OTAzSDEuMzU0OTE5Vi01LjYxMDk1OUgyLjE1OTlWLTUuOTc3NTg0SC45ODgyOTRWMS45OTI1MjhIMi4xNTk5WicvPgo8cGF0aCBpZD0nZzMtOTMnIGQ9J00xLjM1NDkxOS01Ljk3NzU4NEguMTgzMzEzVi01LjYxMDk1OUguOTg4Mjk0VjEuNjI1OTAzSC4xODMzMTNWMS45OTI1MjhIMS4zNTQ5MTlWLTUuOTc3NTg0WicvPgo8cGF0aCBpZD0nZzItMTEnIGQ9J001LjUzNTI0My0zLjAyNDY1OEM1LjUzNTI0My00LjE4NDMwOSA0Ljg3NzcwOS01LjI3MjIyOSAzLjYxMDQ2MS01LjI3MjIyOUMyLjA0NDMzNC01LjI3MjIyOSAuNDc4MjA3LTMuNTYyNjQgLjQ3ODIwNy0xLjg2NTAwNkMuNDc4MjA3LS44MjQ5MDcgMS4xMjM3ODYgLjExOTU1MiAyLjM0MzIxMyAuMTE5NTUyQzMuMDg0NDMzIC4xMTk1NTIgMy45NjkxMTYtLjE2NzM3MiA0LjgxNzkzMy0uODg0NjgyQzQuOTg1MzA1LS4yMTUxOTMgNS4zNTU5MTUgLjExOTU1MiA1Ljg2OTk4OCAuMTE5NTUyQzYuNTE1NTY3IC4xMTk1NTIgNi44MzgzNTYtLjU0OTkzOCA2LjgzODM1Ni0uNzA1MzU1QzYuODM4MzU2LS44MTI5NTEgNi43NTQ2Ny0uODEyOTUxIDYuNzE4ODA0LS44MTI5NTFDNi42MjMxNjMtLjgxMjk1MSA2LjYxMTIwOC0uNzc3MDg2IDYuNTc1MzQyLS42ODE0NDVDNi40Njc3NDYtLjM4MjU2NSA2LjE5Mjc3Ny0uMTE5NTUyIDUuOTA1ODUzLS4xMTk1NTJDNS41MzUyNDMtLjExOTU1MiA1LjUzNTI0My0uODg0NjgyIDUuNTM1MjQzLTEuNjEzOTQ4QzYuNzU0NjctMy4wNzI0NzggNy4wNDE1OTQtNC41Nzg4MjkgNy4wNDE1OTQtNC41OTA3ODVDNy4wNDE1OTQtNC42OTgzODEgNi45NDU5NTMtNC42OTgzODEgNi45MTAwODctNC42OTgzODFDNi44MDI0OTEtNC42OTgzODEgNi43OTA1MzUtNC42NjI1MTYgNi43NDI3MTUtNC40NDczMjNDNi41ODcyOTgtMy45MjEyOTUgNi4yNzY0NjMtMi45ODg3OTIgNS41MzUyNDMtMi4wMDg0NjhWLTMuMDI0NjU4Wk00Ljc4MjA2Ny0xLjE3MTYwNkMzLjczMDAxMi0uMjI3MTQ4IDIuNzg1NTU0LS4xMTk1NTIgMi4zNjcxMjMtLjExOTU1MkMxLjUxODMwNi0uMTE5NTUyIDEuMjc5MjAzLS44NzI3MjcgMS4yNzkyMDMtMS40MzQ2MkMxLjI3OTIwMy0xLjk0ODY5MiAxLjU0MjIxNy0zLjE2ODEyIDEuOTEyODI3LTMuODI1NjU0QzIuNDAyOTg5LTQuNjYyNTE2IDMuMDcyNDc4LTUuMDMzMTI2IDMuNjEwNDYxLTUuMDMzMTI2QzQuNzcwMTEyLTUuMDMzMTI2IDQuNzcwMTEyLTMuNTE0ODE5IDQuNzcwMTEyLTIuNTEwNTg1QzQuNzcwMTEyLTIuMjExNzA2IDQuNzU4MTU3LTEuOTAwODcyIDQuNzU4MTU3LTEuNjAxOTkzQzQuNzU4MTU3LTEuMzYyODg5IDQuNzcwMTEyLTEuMzAzMTEzIDQuNzgyMDY3LTEuMTcxNjA2WicvPgo8cGF0aCBpZD0nZzItMTEzJyBkPSdNNS4yNzIyMjktNS4xNTI2NzdDNS4yNzIyMjktNS4yMTI0NTMgNS4yMjQ0MDgtNS4yNjAyNzQgNS4xNjQ2MzMtNS4yNjAyNzRDNS4wNjg5OTEtNS4yNjAyNzQgNC42MDI3NC00LjgyOTg4OCA0LjM3NTU5Mi00LjQxMTQ1N0M0LjE2MDM5OS00Ljk0OTQ0IDMuNzg5Nzg4LTUuMjcyMjI5IDMuMjc1NzE2LTUuMjcyMjI5QzEuOTI0NzgyLTUuMjcyMjI5IC40NjYyNTItMy41MjY3NzUgLjQ2NjI1Mi0xLjc1NzQxQy40NjYyNTItLjU3Mzg0OCAxLjE1OTY1MSAuMTE5NTUyIDEuOTcyNjAzIC4xMTk1NTJDMi42MDYyMjcgLjExOTU1MiAzLjEzMjI1NC0uMzU4NjU1IDMuMzgzMzEzLS42MzM2MjRMMy4zOTUyNjgtLjYyMTY2OUwyLjk0MDk3MSAxLjE3MTYwNkwyLjgzMzM3NSAxLjYwMTk5M0MyLjcyNTc3OCAxLjk2MDY0OCAyLjU0NjQ1MSAxLjk2MDY0OCAxLjk4NDU1OCAxLjk3MjYwM0MxLjg1MzA1MSAxLjk3MjYwMyAxLjczMzQ5OSAxLjk3MjYwMyAxLjczMzQ5OSAyLjE5OTc1MUMxLjczMzQ5OSAyLjI4MzQzNyAxLjgwNTIzIDIuMzE5MzAzIDEuODg4OTE3IDIuMzE5MzAzQzIuMDU2Mjg5IDIuMzE5MzAzIDIuMjcxNDgyIDIuMjk1MzkyIDIuNDM4ODU0IDIuMjk1MzkySDMuNjU4MjgxQzMuODM3NjA5IDIuMjk1MzkyIDQuMDQwODQ3IDIuMzE5MzAzIDQuMjIwMTc0IDIuMzE5MzAzQzQuMjkxOTA1IDIuMzE5MzAzIDQuNDM1MzY3IDIuMzE5MzAzIDQuNDM1MzY3IDIuMDkyMTU0QzQuNDM1MzY3IDEuOTcyNjAzIDQuMzM5NzI2IDEuOTcyNjAzIDQuMTYwMzk5IDEuOTcyNjAzQzMuNTk4NTA2IDEuOTcyNjAzIDMuNTYyNjQgMS44ODg5MTcgMy41NjI2NCAxLjc5MzI3NUMzLjU2MjY0IDEuNzMzNDk5IDMuNTc0NTk1IDEuNzIxNTQ0IDMuNjEwNDYxIDEuNTY2MTI3TDUuMjcyMjI5LTUuMTUyNjc3Wk0zLjU4NjU1LTEuNDIyNjY1QzMuNTI2Nzc1LTEuMjE5NDI3IDMuNTI2Nzc1LTEuMTk1NTE3IDMuMzU5NDAyLS45NjgzNjlDMy4wOTYzODktLjYzMzYyNCAyLjU3MDM2MS0uMTE5NTUyIDIuMDA4NDY4LS4xMTk1NTJDMS41MTgzMDYtLjExOTU1MiAxLjI0MzMzNy0uNTYxODkzIDEuMjQzMzM3LTEuMjY3MjQ4QzEuMjQzMzM3LTEuOTI0NzgyIDEuNjEzOTQ4LTMuMjYzNzYxIDEuODQxMDk2LTMuNzY1ODc4QzIuMjQ3NTcyLTQuNjAyNzQgMi44MDk0NjUtNS4wMzMxMjYgMy4yNzU3MTYtNS4wMzMxMjZDNC4wNjQ3NTctNS4wMzMxMjYgNC4yMjAxNzQtNC4wNTI4MDIgNC4yMjAxNzQtMy45NTcxNjFDNC4yMjAxNzQtMy45NDUyMDUgNC4xODQzMDktMy43ODk3ODggNC4xNzIzNTQtMy43NjU4NzhMMy41ODY1NS0xLjQyMjY2NVonLz4KPHBhdGggaWQ9J2cyLTEyMCcgZD0nTTUuNjY2NzUtNC44Nzc3MDlDNS4yODQxODQtNC44MDU5NzggNS4xNDA3MjItNC41MTkwNTQgNS4xNDA3MjItNC4yOTE5MDVDNS4xNDA3MjItNC4wMDQ5ODEgNS4zNjc4Ny0zLjkwOTM0IDUuNTM1MjQzLTMuOTA5MzRDNS44OTM4OTgtMy45MDkzNCA2LjE0NDk1Ni00LjIyMDE3NCA2LjE0NDk1Ni00LjU0Mjk2NEM2LjE0NDk1Ni01LjA0NTA4MSA1LjU3MTEwOC01LjI3MjIyOSA1LjA2ODk5MS01LjI3MjIyOUM0LjMzOTcyNi01LjI3MjIyOSAzLjkzMzI1LTQuNTU0OTE5IDMuODI1NjU0LTQuMzI3NzcxQzMuNTUwNjg1LTUuMjI0NDA4IDIuODA5NDY1LTUuMjcyMjI5IDIuNTk0MjcxLTUuMjcyMjI5QzEuMzc0ODQ0LTUuMjcyMjI5IC43MjkyNjUtMy43MDYxMDIgLjcyOTI2NS0zLjQ0MzA4OEMuNzI5MjY1LTMuMzk1MjY4IC43NzcwODYtMy4zMzU0OTIgLjg2MDc3Mi0zLjMzNTQ5MkMuOTU2NDEzLTMuMzM1NDkyIC45ODAzMjQtMy40MDcyMjMgMS4wMDQyMzQtMy40NTUwNDRDMS40MTA3MS00Ljc4MjA2NyAyLjIxMTcwNi01LjAzMzEyNiAyLjU1ODQwNi01LjAzMzEyNkMzLjA5NjM4OS01LjAzMzEyNiAzLjIwMzk4NS00LjUzMTAwOSAzLjIwMzk4NS00LjI0NDA4NUMzLjIwMzk4NS0zLjk4MTA3MSAzLjEzMjI1NC0zLjcwNjEwMiAyLjk4ODc5Mi0zLjEzMjI1NEwyLjU4MjMxNi0xLjQ5NDM5NkMyLjQwMjk4OS0uNzc3MDg2IDIuMDU2Mjg5LS4xMTk1NTIgMS40MjI2NjUtLjExOTU1MkMxLjM2Mjg4OS0uMTE5NTUyIDEuMDY0MDEtLjExOTU1MiAuODEyOTUxLS4yNzQ5NjlDMS4yNDMzMzctLjM1ODY1NSAxLjMzODk3OS0uNzE3MzEgMS4zMzg5NzktLjg2MDc3MkMxLjMzODk3OS0xLjA5OTg3NSAxLjE1OTY1MS0xLjI0MzMzNyAuOTMyNTAzLTEuMjQzMzM3Qy42NDU1NzktMS4yNDMzMzcgLjMzNDc0NS0uOTkyMjc5IC4zMzQ3NDUtLjYwOTcxNEMuMzM0NzQ1LS4xMDc1OTcgLjg5NjYzOCAuMTE5NTUyIDEuNDEwNzEgLjExOTU1MkMxLjk4NDU1OCAuMTE5NTUyIDIuMzkxMDM0LS4zMzQ3NDUgMi42NDIwOTItLjgyNDkwN0MyLjgzMzM3NS0uMTE5NTUyIDMuNDMxMTMzIC4xMTk1NTIgMy44NzM0NzQgLjExOTU1MkM1LjA5MjkwMiAuMTE5NTUyIDUuNzM4NDgxLTEuNDQ2NTc1IDUuNzM4NDgxLTEuNzA5NTg5QzUuNzM4NDgxLTEuNzY5MzY1IDUuNjkwNjYtMS44MTcxODYgNS42MTg5MjktMS44MTcxODZDNS41MTEzMzMtMS44MTcxODYgNS40OTkzNzctMS43NTc0MSA1LjQ2MzUxMi0xLjY2MTc2OEM1LjE0MDcyMi0uNjA5NzE0IDQuNDQ3MzIzLS4xMTk1NTIgMy45MDkzNC0uMTE5NTUyQzMuNDkwOTA5LS4xMTk1NTIgMy4yNjM3NjEtLjQzMDM4NiAzLjI2Mzc2MS0uOTIwNTQ4QzMuMjYzNzYxLTEuMTgzNTYyIDMuMzExNTgyLTEuMzc0ODQ0IDMuNTAyODY0LTIuMTYzODg1TDMuOTIxMjk1LTMuNzg5Nzg4QzQuMTAwNjIzLTQuNTA3MDk4IDQuNTA3MDk4LTUuMDMzMTI2IDUuMDU3MDM2LTUuMDMzMTI2QzUuMDgwOTQ2LTUuMDMzMTI2IDUuNDE1NjkxLTUuMDMzMTI2IDUuNjY2NzUtNC44Nzc3MDlaJy8+CjxwYXRoIGlkPSdnMC05OCcgZD0nTTMuMzExNTgyLTguMTg5MjlMNi41NjMzODctNi43MTg4MDRMNi43MDY4NDktNi45ODE4MThMMy4zMjM1MzctOC44OTQ2NDVMLS4wNTk3NzYtNi45ODE4MThMLjA3MTczMS02LjcxODgwNEwzLjMxMTU4Mi04LjE4OTI5WicvPgo8L2RlZnM+CjxnIGlkPSdwYWdlMSc+Cjx1c2UgeD0nMTUxLjk5MjA4NycgeT0nLTQuNDgzMzEnIHhsaW5rOmhyZWY9JyNnMC05OCcvPgo8dXNlIHg9JzE1MS41Mjc5MDEnIHk9Jy00LjQ4MzI5NCcgeGxpbms6aHJlZj0nI2cyLTExMycvPgo8dXNlIHg9JzE1Ni43MTgxMDgnIHk9Jy0yLjY5MDAzMScgeGxpbms6aHJlZj0nI2cxLTg4Jy8+Cjx1c2UgeD0nMTY0LjgwMzE2MScgeT0nLTQuNDgzMjk0JyB4bGluazpocmVmPScjZzQtNDAnLz4KPHVzZSB4PScxNjkuMzU1NDg3JyB5PSctNC40ODMyOTQnIHhsaW5rOmhyZWY9JyNnMi0xMScvPgo8dXNlIHg9JzE3Ni44NzcyMTEnIHk9Jy00LjQ4MzI5NCcgeGxpbms6aHJlZj0nI2c0LTQxJy8+Cjx1c2UgeD0nMTg0Ljc1MDM2NicgeT0nLTQuNDgzMjk0JyB4bGluazpocmVmPScjZzQtNjEnLz4KPHVzZSB4PScxOTcuMTc1ODQ3JyB5PSctNC40ODMyOTQnIHhsaW5rOmhyZWY9JyNnMi0xMjAnLz4KPHVzZSB4PScyMDMuODI3OTM0JyB5PSctMi42MjM1ODQnIHhsaW5rOmhyZWY9JyNnMy00MCcvPgo8dXNlIHg9JzIwNy4xMjExODgnIHk9Jy0yLjYyMzU4NCcgeGxpbms6aHJlZj0nI2czLTkxJy8+Cjx1c2UgeD0nMjA5LjQ3MzUxMScgeT0nLTIuNjIzNTg0JyB4bGluazpocmVmPScjZzEtMTEwJy8+Cjx1c2UgeD0nMjE0LjYxMTcxNCcgeT0nLTIuNjIzNTg0JyB4bGluazpocmVmPScjZzEtMTEnLz4KPHVzZSB4PScyMjAuMDUwNjUzJyB5PSctMi42MjM1ODQnIHhsaW5rOmhyZWY9JyNnMy05MycvPgo8dXNlIHg9JzIyMi40MDI5NzcnIHk9Jy0yLjYyMzU4NCcgeGxpbms6aHJlZj0nI2czLTQzJy8+Cjx1c2UgeD0nMjI4Ljk4OTQ4NCcgeT0nLTIuNjIzNTg0JyB4bGluazpocmVmPScjZzMtNDknLz4KPHVzZSB4PScyMzMuMjIzNjY2JyB5PSctMi42MjM1ODQnIHhsaW5rOmhyZWY9JyNnMy00MScvPgo8L2c+Cjwvc3ZnPgo8IS0tIERFUFRIPTAgLS0+)
where ![[\sampleSize\alpha]](data:image/svg+xml;base64,PD94bWwgdmVyc2lvbj0nMS4wJyBlbmNvZGluZz0nVVRGLTgnPz4KPCEtLSBUaGlzIGZpbGUgd2FzIGdlbmVyYXRlZCBieSBkdmlzdmdtIDMuNC4yIC0tPgo8c3ZnIHZlcnNpb249JzEuMScgeG1sbnM9J2h0dHA6Ly93d3cudzMub3JnLzIwMDAvc3ZnJyB4bWxuczp4bGluaz0naHR0cDovL3d3dy53My5vcmcvMTk5OS94bGluaycgd2lkdGg9JzIxLjAxMjY1MnB0JyBoZWlnaHQ9JzExLjk1NTE2OHB0JyB2aWV3Qm94PScwIC04Ljk2NjM3NiAyMS4wMTI2NTIgMTEuOTU1MTY4Jz4KPGRlZnM+CjxwYXRoIGlkPSdnMC0xMScgZD0nTTUuNTM1MjQzLTMuMDI0NjU4QzUuNTM1MjQzLTQuMTg0MzA5IDQuODc3NzA5LTUuMjcyMjI5IDMuNjEwNDYxLTUuMjcyMjI5QzIuMDQ0MzM0LTUuMjcyMjI5IC40NzgyMDctMy41NjI2NCAuNDc4MjA3LTEuODY1MDA2Qy40NzgyMDctLjgyNDkwNyAxLjEyMzc4NiAuMTE5NTUyIDIuMzQzMjEzIC4xMTk1NTJDMy4wODQ0MzMgLjExOTU1MiAzLjk2OTExNi0uMTY3MzcyIDQuODE3OTMzLS44ODQ2ODJDNC45ODUzMDUtLjIxNTE5MyA1LjM1NTkxNSAuMTE5NTUyIDUuODY5OTg4IC4xMTk1NTJDNi41MTU1NjcgLjExOTU1MiA2LjgzODM1Ni0uNTQ5OTM4IDYuODM4MzU2LS43MDUzNTVDNi44MzgzNTYtLjgxMjk1MSA2Ljc1NDY3LS44MTI5NTEgNi43MTg4MDQtLjgxMjk1MUM2LjYyMzE2My0uODEyOTUxIDYuNjExMjA4LS43NzcwODYgNi41NzUzNDItLjY4MTQ0NUM2LjQ2Nzc0Ni0uMzgyNTY1IDYuMTkyNzc3LS4xMTk1NTIgNS45MDU4NTMtLjExOTU1MkM1LjUzNTI0My0uMTE5NTUyIDUuNTM1MjQzLS44ODQ2ODIgNS41MzUyNDMtMS42MTM5NDhDNi43NTQ2Ny0zLjA3MjQ3OCA3LjA0MTU5NC00LjU3ODgyOSA3LjA0MTU5NC00LjU5MDc4NUM3LjA0MTU5NC00LjY5ODM4MSA2Ljk0NTk1My00LjY5ODM4MSA2LjkxMDA4Ny00LjY5ODM4MUM2LjgwMjQ5MS00LjY5ODM4MSA2Ljc5MDUzNS00LjY2MjUxNiA2Ljc0MjcxNS00LjQ0NzMyM0M2LjU4NzI5OC0zLjkyMTI5NSA2LjI3NjQ2My0yLjk4ODc5MiA1LjUzNTI0My0yLjAwODQ2OFYtMy4wMjQ2NThaTTQuNzgyMDY3LTEuMTcxNjA2QzMuNzMwMDEyLS4yMjcxNDggMi43ODU1NTQtLjExOTU1MiAyLjM2NzEyMy0uMTE5NTUyQzEuNTE4MzA2LS4xMTk1NTIgMS4yNzkyMDMtLjg3MjcyNyAxLjI3OTIwMy0xLjQzNDYyQzEuMjc5MjAzLTEuOTQ4NjkyIDEuNTQyMjE3LTMuMTY4MTIgMS45MTI4MjctMy44MjU2NTRDMi40MDI5ODktNC42NjI1MTYgMy4wNzI0NzgtNS4wMzMxMjYgMy42MTA0NjEtNS4wMzMxMjZDNC43NzAxMTItNS4wMzMxMjYgNC43NzAxMTItMy41MTQ4MTkgNC43NzAxMTItMi41MTA1ODVDNC43NzAxMTItMi4yMTE3MDYgNC43NTgxNTctMS45MDA4NzIgNC43NTgxNTctMS42MDE5OTNDNC43NTgxNTctMS4zNjI4ODkgNC43NzAxMTItMS4zMDMxMTMgNC43ODIwNjctMS4xNzE2MDZaJy8+CjxwYXRoIGlkPSdnMC0xMTAnIGQ9J00yLjQ2Mjc2NS0zLjUwMjg2NEMyLjQ4NjY3NS0zLjU3NDU5NSAyLjc4NTU1NC00LjE3MjM1NCAzLjIyNzg5NS00LjU1NDkxOUMzLjUzODczLTQuODQxODQzIDMuOTQ1MjA1LTUuMDMzMTI2IDQuNDExNDU3LTUuMDMzMTI2QzQuODg5NjY0LTUuMDMzMTI2IDUuMDU3MDM2LTQuNjc0NDcxIDUuMDU3MDM2LTQuMTk2MjY0QzUuMDU3MDM2LTMuNTE0ODE5IDQuNTY2ODc0LTIuMTUxOTMgNC4zMjc3NzEtMS41MDYzNTFDNC4yMjAxNzQtMS4yMTk0MjcgNC4xNjAzOTktMS4wNjQwMSA0LjE2MDM5OS0uODQ4ODE3QzQuMTYwMzk5LS4zMTA4MzQgNC41MzEwMDkgLjExOTU1MiA1LjEwNDg1NyAuMTE5NTUyQzYuMjE2Njg3IC4xMTk1NTIgNi42MzUxMTgtMS42Mzc4NTggNi42MzUxMTgtMS43MDk1ODlDNi42MzUxMTgtMS43NjkzNjUgNi41ODcyOTgtMS44MTcxODYgNi41MTU1NjctMS44MTcxODZDNi40MDc5Ny0xLjgxNzE4NiA2LjM5NjAxNS0xLjc4MTMyIDYuMzM2MjM5LTEuNTc4MDgyQzYuMDYxMjctLjU5Nzc1OCA1LjYwNjk3NC0uMTE5NTUyIDUuMTQwNzIyLS4xMTk1NTJDNS4wMjExNzEtLjExOTU1MiA0LjgyOTg4OC0uMTMxNTA3IDQuODI5ODg4LS41MTQwNzJDNC44Mjk4ODgtLjgxMjk1MSA0Ljk2MTM5NS0xLjE3MTYwNiA1LjAzMzEyNi0xLjMzODk3OUM1LjI3MjIyOS0xLjk5NjUxMyA1Ljc3NDM0Ni0zLjMzNTQ5MiA1Ljc3NDM0Ni00LjAxNjkzNkM1Ljc3NDM0Ni00LjczNDI0NyA1LjM1NTkxNS01LjI3MjIyOSA0LjQ0NzMyMy01LjI3MjIyOUMzLjM4MzMxMy01LjI3MjIyOSAyLjgyMTQyLTQuNTE5MDU0IDIuNjA2MjI3LTQuMjIwMTc0QzIuNTcwMzYxLTQuOTAxNjE5IDIuMDgwMTk5LTUuMjcyMjI5IDEuNTU0MTcyLTUuMjcyMjI5QzEuMTcxNjA2LTUuMjcyMjI5IC45MDg1OTMtNS4wNDUwODEgLjcwNTM1NS00LjYzODYwNUMuNDkwMTYyLTQuMjA4MjE5IC4zMjI3OS0zLjQ5MDkwOSAuMzIyNzktMy40NDMwODhTLjM3MDYxLTMuMzM1NDkyIC40NTQyOTYtMy4zMzU0OTJDLjU0OTkzOC0zLjMzNTQ5MiAuNTYxODkzLTMuMzQ3NDQ3IC42MzM2MjQtMy42MjI0MTZDLjgyNDkwNy00LjM1MTY4MSAxLjA0MDEtNS4wMzMxMjYgMS41MTgzMDYtNS4wMzMxMjZDMS43OTMyNzUtNS4wMzMxMjYgMS44ODg5MTctNC44NDE4NDMgMS44ODg5MTctNC40ODMxODhDMS44ODg5MTctNC4yMjAxNzQgMS43NjkzNjUtMy43NTM5MjMgMS42ODU2NzktMy4zODMzMTNMMS4zNTA5MzQtMi4wOTIxNTRDMS4zMDMxMTMtMS44NjUwMDYgMS4xNzE2MDYtMS4zMjcwMjQgMS4xMTE4MzEtMS4xMTE4MzFDMS4wMjgxNDQtLjgwMDk5NiAuODk2NjM4LS4yMzkxMDMgLjg5NjYzOC0uMTc5MzI4Qy44OTY2MzgtLjAxMTk1NSAxLjAyODE0NCAuMTE5NTUyIDEuMjA3NDcyIC4xMTk1NTJDMS4zNTA5MzQgLjExOTU1MiAxLjUxODMwNiAuMDQ3ODIxIDEuNjEzOTQ4LS4xMzE1MDdDMS42Mzc4NTgtLjE5MTI4MyAxLjc0NTQ1NS0uNjA5NzE0IDEuODA1MjMtLjg0ODgxN0wyLjA2ODI0NC0xLjkyNDc4MkwyLjQ2Mjc2NS0zLjUwMjg2NFonLz4KPHBhdGggaWQ9J2cxLTkxJyBkPSdNMi45ODg3OTIgMi45ODg3OTJWMi41NDY0NTFIMS44MjkxNDFWLTguNTI0MDM1SDIuOTg4NzkyVi04Ljk2NjM3NkgxLjM4NjhWMi45ODg3OTJIMi45ODg3OTJaJy8+CjxwYXRoIGlkPSdnMS05MycgZD0nTTEuODUzMDUxLTguOTY2Mzc2SC4yNTEwNTlWLTguNTI0MDM1SDEuNDEwNzFWMi41NDY0NTFILjI1MTA1OVYyLjk4ODc5MkgxLjg1MzA1MVYtOC45NjYzNzZaJy8+CjwvZGVmcz4KPGcgaWQ9J3BhZ2UxJz4KPHVzZSB4PScwJyB5PScwJyB4bGluazpocmVmPScjZzEtOTEnLz4KPHVzZSB4PSczLjI1MTY2MScgeT0nMCcgeGxpbms6aHJlZj0nI2cwLTExMCcvPgo8dXNlIHg9JzEwLjIzOTI2NycgeT0nMCcgeGxpbms6aHJlZj0nI2cwLTExJy8+Cjx1c2UgeD0nMTcuNzYwOTkxJyB5PScwJyB4bGluazpocmVmPScjZzEtOTMnLz4KPC9nPgo8L3N2Zz4KPCEtLSBERVBUSD00IC0tPg==) denotes the integral part of
denotes the integral part of  and
and  is the sample sorted in ascended order:

Thus, the  smallest value of the sample
 is an estimate
  of the
-quantile where
of the
-quantile where  , for
, for  .
.
The QQ-plot draws the couples
 .
If follows the distribution , then the points should be close to the diagonal.
.
If follows the distribution , then the points should be close to the diagonal.
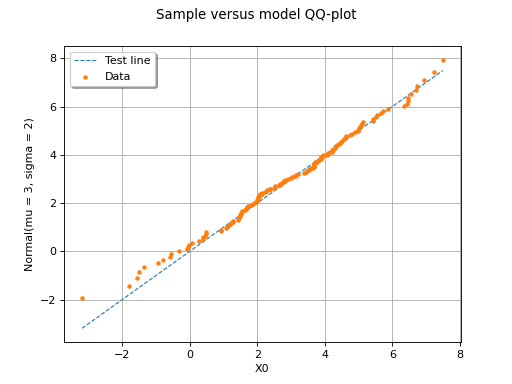
The following figure illustrates a QQ-plot with a
sample of size  . In this example, the
points remain close to the diagonal and the hypothesis “ is the
cumulative distribution function of ” does not seem false,
even if a more quantitative analysis should be
carried out to confirm this.
. In this example, the
points remain close to the diagonal and the hypothesis “ is the
cumulative distribution function of ” does not seem false,
even if a more quantitative analysis should be
carried out to confirm this.
(Source code, png)
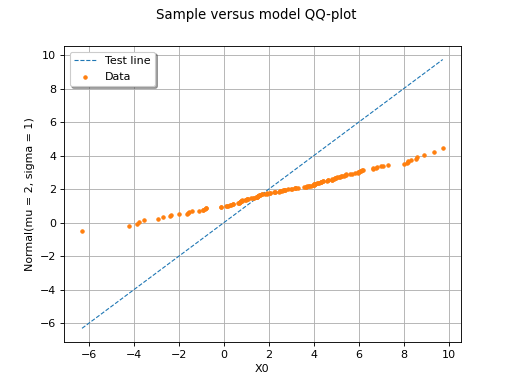
In this second example, the tested continuous distribution is clearly false.
(Source code, png)
Normal probability plot (Henry’s line)
This test is dedicated to the normal distribution.
The following result is used in the test: if follows the  distribution,
then
distribution,
then  follows the
  distribution. Furthermore, let
  be the quantile of order of and let
  be the quantile of order of . Then we have the relation:

Then the Henri line draws the QQ-plot built from the empirical quantiles of order  and the quantiles of same order of the distribution. If the sample comes from the
distribution, then the points should be close to the line of equation
and the quantiles of same order of the distribution. If the sample comes from the
distribution, then the points should be close to the line of equation  .
.
The following figure illustrates the Henry’s line
with a sample of size . In this
example, the points remain close to a line and the hypothesis “ follows
a normal distribution“ does not seem
false, even if a more quantitative analysis
should be carried out to confirm this.
(Source code, png)
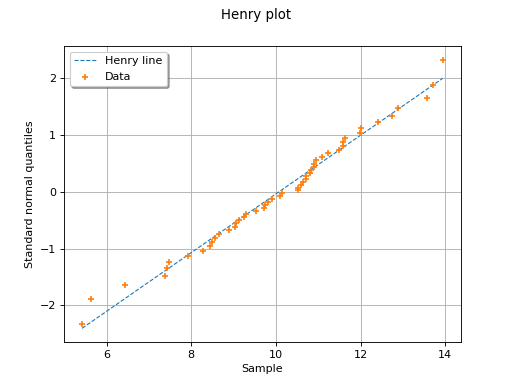

In this second example, the hypothesis of a normal distribution seems
far less plausible because of the behavior for small values of
.
(Source code, png)
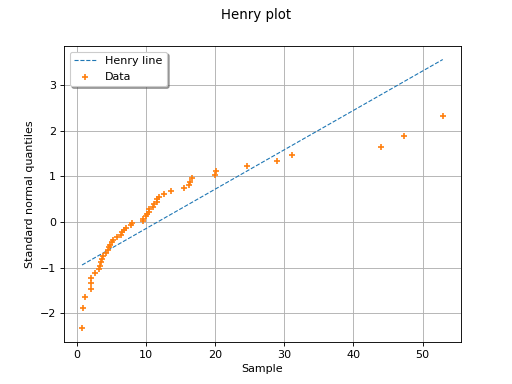

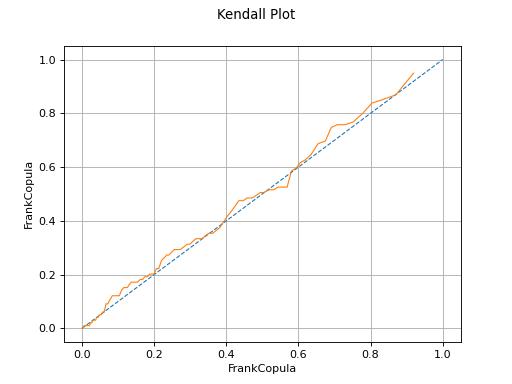
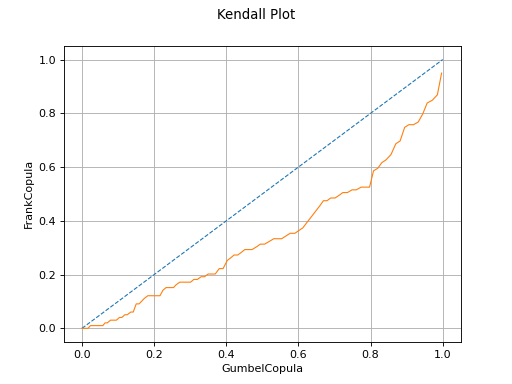
Kendall plot
In the bivariate case, the Kendall Plot test allows one to validate whether a sample is drawn from a given copula or to check whether two samples share the same copula.
Let  be a bivariate random vector with the copula
  and
the marginal cumulative distribution functions
and
the marginal cumulative distribution functions  .
Let
.
Let  be the random vector with
  marginal distributions
and copula.
marginal distributions
and copula.
Let  a sample drawn from
  . We build the rank sample
defined by
. We build the rank sample
defined by  where
where  .
.
We define:

where  is a bivariate random vector with marginal distributions and copula.
We denote by
is a bivariate random vector with marginal distributions and copula.
We denote by  the cumulative distribution function of
  .
.
We can get a sample of denoted by  from the sample
as follows:
from the sample
as follows:

where  is the empirical cumulative distribution function
of the sample .
Then, we have, for all
is the empirical cumulative distribution function
of the sample .
Then, we have, for all  :
:
![\widehat{h}_i = \frac{1}{\sampleSize-1} Card
\left\{ j \in [1,\sampleSize], j \neq i, \, | \, X^j_1 \leq X^i_1 \mbox{ and } X^j_2 \leq X^i_2 \right \}](data:image/svg+xml;base64,PD94bWwgdmVyc2lvbj0nMS4wJyBlbmNvZGluZz0nVVRGLTgnPz4KPCEtLSBUaGlzIGZpbGUgd2FzIGdlbmVyYXRlZCBieSBkdmlzdmdtIDMuNC4yIC0tPgo8c3ZnIHZlcnNpb249JzEuMScgeG1sbnM9J2h0dHA6Ly93d3cudzMub3JnLzIwMDAvc3ZnJyB4bWxuczp4bGluaz0naHR0cDovL3d3dy53My5vcmcvMTk5OS94bGluaycgd2lkdGg9JzMwNC4yNjY2OTJwdCcgaGVpZ2h0PScyNC45ODkxMzVwdCcgdmlld0JveD0nNDEuOTk5Nzg4IC0yNC45ODkxMjcgMzA0LjI2NjY5MiAyNC45ODkxMzUnPgo8ZGVmcz4KPHBhdGggaWQ9J2c0LTQ5JyBkPSdNMi41MDI2MTUtNS4wNzY5NjFDMi41MDI2MTUtNS4yOTIxNTQgMi40ODY2NzUtNS4zMDAxMjUgMi4yNzE0ODItNS4zMDAxMjVDMS45NDQ3MDctNC45ODEzMiAxLjUyMjI5MS00Ljc5MDAzNyAuNzY1MTMxLTQuNzkwMDM3Vi00LjUyNzAyNEMuOTgwMzI0LTQuNTI3MDI0IDEuNDEwNzEtNC41MjcwMjQgMS44NzI5NzYtNC43NDIyMTdWLS42NTM1NDlDMS44NzI5NzYtLjM1ODY1NSAxLjg0OTA2Ni0uMjYzMDE0IDEuMDkxOTA1LS4yNjMwMTRILjgxMjk1MVYwQzEuMTM5NzI2LS4wMjM5MSAxLjgyNTE1Ni0uMDIzOTEgMi4xODM4MTEtLjAyMzkxUzMuMjM1ODY2LS4wMjM5MSAzLjU2MjY0IDBWLS4yNjMwMTRIMy4yODM2ODZDMi41MjY1MjYtLjI2MzAxNCAyLjUwMjYxNS0uMzU4NjU1IDIuNTAyNjE1LS42NTM1NDlWLTUuMDc2OTYxWicvPgo8cGF0aCBpZD0nZzQtNTAnIGQ9J00yLjI0NzU3Mi0xLjYyNTkwM0MyLjM3NTA5My0xLjc0NTQ1NSAyLjcwOTgzOC0yLjAwODQ2OCAyLjgzNzM2LTIuMTIwMDVDMy4zMzE1MDctMi41NzQzNDYgMy44MDE3NDMtMy4wMTI3MDIgMy44MDE3NDMtMy43Mzc5ODNDMy44MDE3NDMtNC42ODY0MjYgMy4wMDQ3MzItNS4zMDAxMjUgMi4wMDg0NjgtNS4zMDAxMjVDMS4wNTIwNTUtNS4zMDAxMjUgLjQyMjQxNi00LjU3NDg0NCAuNDIyNDE2LTMuODY1NTA0Qy40MjI0MTYtMy40NzQ5NjkgLjczMzI1LTMuNDE5MTc4IC44NDQ4MzItMy40MTkxNzhDMS4wMTIyMDQtMy40MTkxNzggMS4yNTkyNzgtMy41Mzg3MyAxLjI1OTI3OC0zLjg0MTU5NEMxLjI1OTI3OC00LjI1NjA0IC44NjA3NzItNC4yNTYwNCAuNzY1MTMxLTQuMjU2MDRDLjk5NjI2NC00LjgzNzg1OCAxLjUzMDI2Mi01LjAzNzExMSAxLjkyMDc5Ny01LjAzNzExMUMyLjY2MjAxNy01LjAzNzExMSAzLjA0NDU4My00LjQwNzQ3MiAzLjA0NDU4My0zLjczNzk4M0MzLjA0NDU4My0yLjkwOTA5MSAyLjQ2Mjc2NS0yLjMwMzM2MiAxLjUyMjI5MS0xLjMzODk3OUwuNTE4MDU3LS4zMDI4NjRDLjQyMjQxNi0uMjE1MTkzIC40MjI0MTYtLjE5OTI1MyAuNDIyNDE2IDBIMy41NzA2MUwzLjgwMTc0My0xLjQyNjY1SDMuNTU0NjdDMy41MzA3Ni0xLjI2NzI0OCAzLjQ2Njk5OS0uODY4NzQyIDMuMzcxMzU3LS43MTczMUMzLjMyMzUzNy0uNjUzNTQ5IDIuNzE3ODA4LS42NTM1NDkgMi41OTAyODYtLjY1MzU0OUgxLjE3MTYwNkwyLjI0NzU3Mi0xLjYyNTkwM1onLz4KPHBhdGggaWQ9J2c1LTQ5JyBkPSdNMy40NDMwODgtNy42NjMyNjNDMy40NDMwODgtNy45MzgyMzIgMy40NDMwODgtNy45NTAxODcgMy4yMDM5ODUtNy45NTAxODdDMi45MTcwNjEtNy42MjczOTcgMi4zMTkzMDMtNy4xODUwNTYgMS4wODc5Mi03LjE4NTA1NlYtNi44MzgzNTZDMS4zNjI4ODktNi44MzgzNTYgMS45NjA2NDgtNi44MzgzNTYgMi42MTgxODItNy4xNDkxOTFWLS45MjA1NDhDMi42MTgxODItLjQ5MDE2MiAyLjU4MjMxNi0uMzQ2NyAxLjUzMDI2Mi0uMzQ2N0gxLjE1OTY1MVYwQzEuNDgyNDQxLS4wMjM5MSAyLjY0MjA5Mi0uMDIzOTEgMy4wMzY2MTMtLjAyMzkxUzQuNTc4ODI5LS4wMjM5MSA0LjkwMTYxOSAwVi0uMzQ2N0g0LjUzMTAwOUMzLjQ3ODk1NC0uMzQ2NyAzLjQ0MzA4OC0uNDkwMTYyIDMuNDQzMDg4LS45MjA1NDhWLTcuNjYzMjYzWicvPgo8cGF0aCBpZD0nZzUtNjEnIGQ9J004LjA2OTczOC0zLjg3MzQ3NEM4LjIzNzExMS0zLjg3MzQ3NCA4LjQ1MjMwNC0zLjg3MzQ3NCA4LjQ1MjMwNC00LjA4ODY2N0M4LjQ1MjMwNC00LjMxNTgxNiA4LjI0OTA2Ni00LjMxNTgxNiA4LjA2OTczOC00LjMxNTgxNkgxLjAyODE0NEMuODYwNzcyLTQuMzE1ODE2IC42NDU1NzktNC4zMTU4MTYgLjY0NTU3OS00LjEwMDYyM0MuNjQ1NTc5LTMuODczNDc0IC44NDg4MTctMy44NzM0NzQgMS4wMjgxNDQtMy44NzM0NzRIOC4wNjk3MzhaTTguMDY5NzM4LTEuNjQ5ODEzQzguMjM3MTExLTEuNjQ5ODEzIDguNDUyMzA0LTEuNjQ5ODEzIDguNDUyMzA0LTEuODY1MDA2QzguNDUyMzA0LTIuMDkyMTU0IDguMjQ5MDY2LTIuMDkyMTU0IDguMDY5NzM4LTIuMDkyMTU0SDEuMDI4MTQ0Qy44NjA3NzItMi4wOTIxNTQgLjY0NTU3OS0yLjA5MjE1NCAuNjQ1NTc5LTEuODc2OTYxQy42NDU1NzktMS42NDk4MTMgLjg0ODgxNy0xLjY0OTgxMyAxLjAyODE0NC0xLjY0OTgxM0g4LjA2OTczOFonLz4KPHBhdGggaWQ9J2c1LTkxJyBkPSdNMi45ODg3OTIgMi45ODg3OTJWMi41NDY0NTFIMS44MjkxNDFWLTguNTI0MDM1SDIuOTg4NzkyVi04Ljk2NjM3NkgxLjM4NjhWMi45ODg3OTJIMi45ODg3OTJaJy8+CjxwYXRoIGlkPSdnNS05MycgZD0nTTEuODUzMDUxLTguOTY2Mzc2SC4yNTEwNTlWLTguNTI0MDM1SDEuNDEwNzFWMi41NDY0NTFILjI1MTA1OVYyLjk4ODc5MkgxLjg1MzA1MVYtOC45NjYzNzZaJy8+CjxwYXRoIGlkPSdnNS05NycgZD0nTTQuNjE0Njk1LTMuMTkyMDNDNC42MTQ2OTUtMy44Mzc2MDkgNC42MTQ2OTUtNC4zMTU4MTYgNC4wODg2NjctNC43ODIwNjdDMy42NzAyMzctNS4xNjQ2MzMgMy4xMzIyNTQtNS4zMzIwMDUgMi42MDYyMjctNS4zMzIwMDVDMS42MjU5MDMtNS4zMzIwMDUgLjg3MjcyNy00LjY4NjQyNiAuODcyNzI3LTMuOTA5MzRDLjg3MjcyNy0zLjU2MjY0IDEuMDk5ODc1LTMuMzk1MjY4IDEuMzc0ODQ0LTMuMzk1MjY4QzEuNjYxNzY4LTMuMzk1MjY4IDEuODY1MDA2LTMuNTk4NTA2IDEuODY1MDA2LTMuODg1NDNDMS44NjUwMDYtNC4zNzU1OTIgMS40MzQ2Mi00LjM3NTU5MiAxLjI1NTI5My00LjM3NTU5MkMxLjUzMDI2Mi00Ljg3NzcwOSAyLjEwNDExLTUuMDkyOTAyIDIuNTgyMzE2LTUuMDkyOTAyQzMuMTMyMjU0LTUuMDkyOTAyIDMuODM3NjA5LTQuNjM4NjA1IDMuODM3NjA5LTMuNTYyNjRWLTMuMDg0NDMzQzEuNDM0NjItMy4wNDg1NjggLjUyNjAyNy0yLjA0NDMzNCAuNTI2MDI3LTEuMTIzNzg2Qy41MjYwMjctLjE3OTMyOCAxLjYyNTkwMyAuMTE5NTUyIDIuMzU1MTY4IC4xMTk1NTJDMy4xNDQyMDkgLjExOTU1MiAzLjY4MjE5Mi0uMzU4NjU1IDMuOTA5MzQtLjkzMjUwM0MzLjk1NzE2MS0uMzcwNjEgNC4zMjc3NzEgLjA1OTc3NiA0Ljg0MTg0MyAuMDU5Nzc2QzUuMDkyOTAyIC4wNTk3NzYgNS43ODYzMDEtLjEwNzU5NyA1Ljc4NjMwMS0xLjA2NDAxVi0xLjczMzQ5OUg1LjUyMzI4OFYtMS4wNjQwMUM1LjUyMzI4OC0uMzgyNTY1IDUuMjM2MzY0LS4yODY5MjQgNS4wNjg5OTEtLjI4NjkyNEM0LjYxNDY5NS0uMjg2OTI0IDQuNjE0Njk1LS45MjA1NDggNC42MTQ2OTUtMS4wOTk4NzVWLTMuMTkyMDNaTTMuODM3NjA5LTEuNjg1Njc5QzMuODM3NjA5LS41MTQwNzIgMi45NjQ4ODItLjExOTU1MiAyLjQ1MDgwOS0uMTE5NTUyQzEuODY1MDA2LS4xMTk1NTIgMS4zNzQ4NDQtLjU0OTkzOCAxLjM3NDg0NC0xLjEyMzc4NkMxLjM3NDg0NC0yLjcwMTg2OCAzLjQwNzIyMy0yLjg0NTMzIDMuODM3NjA5LTIuODY5MjRWLTEuNjg1Njc5WicvPgo8cGF0aCBpZD0nZzUtMTAwJyBkPSdNMy41ODY1NS04LjE2NTM4Vi03LjgxODY4QzQuMzk5NTAyLTcuODE4NjggNC40OTUxNDMtNy43MzQ5OTQgNC40OTUxNDMtNy4xNDkxOTFWLTQuNTA3MDk4QzQuMjQ0MDg1LTQuODUzNzk4IDMuNzMwMDEyLTUuMjcyMjI5IDMuMDAwNzQ3LTUuMjcyMjI5QzEuNjEzOTQ4LTUuMjcyMjI5IC40MTg0MzEtNC4xMDA2MjMgLjQxODQzMS0yLjU3MDM2MUMuNDE4NDMxLTEuMDUyMDU1IDEuNTU0MTcyIC4xMTk1NTIgMi44NjkyNCAuMTE5NTUyQzMuNzc3ODMzIC4xMTk1NTIgNC4zMDM4NjEtLjQ3ODIwNyA0LjQ3MTIzMy0uNzA1MzU1Vi4xMTk1NTJMNi4xNTY5MTIgMFYtLjM0NjdDNS4zNDM5Ni0uMzQ2NyA1LjI0ODMxOS0uNDMwMzg2IDUuMjQ4MzE5LTEuMDE2MTg5Vi04LjI5Njg4N0wzLjU4NjU1LTguMTY1MzhaTTQuNDcxMjMzLTEuMzk4NzU1QzQuNDcxMjMzLTEuMTgzNTYyIDQuNDcxMjMzLTEuMTQ3Njk2IDQuMzAzODYxLS44ODQ2ODJDNC4wMTY5MzYtLjQ2NjI1MiAzLjUyNjc3NS0uMTE5NTUyIDIuOTI5MDE2LS4xMTk1NTJDMi42MTgxODItLjExOTU1MiAxLjMyNzAyNC0uMjM5MTAzIDEuMzI3MDI0LTIuNTU4NDA2QzEuMzI3MDI0LTMuNDE5MTc4IDEuNDcwNDg2LTMuODk3Mzg1IDEuNzMzNDk5LTQuMjkxOTA1QzEuOTcyNjAzLTQuNjYyNTE2IDIuNDUwODA5LTUuMDMzMTI2IDMuMDQ4NTY4LTUuMDMzMTI2QzMuNzg5Nzg4LTUuMDMzMTI2IDQuMjA4MjE5LTQuNDk1MTQzIDQuMzI3NzcxLTQuMzAzODYxQzQuNDcxMjMzLTQuMTAwNjIzIDQuNDcxMjMzLTQuMDc2NzEyIDQuNDcxMjMzLTMuODYxNTE5Vi0xLjM5ODc1NVonLz4KPHBhdGggaWQ9J2c1LTExMCcgZD0nTTUuMzIwMDUtMi45MDUxMDZDNS4zMjAwNS00LjAxNjkzNiA1LjMyMDA1LTQuMzUxNjgxIDUuMDQ1MDgxLTQuNzM0MjQ3QzQuNjk4MzgxLTUuMjAwNDk4IDQuMTM2NDg4LTUuMjcyMjI5IDMuNzMwMDEyLTUuMjcyMjI5QzIuNTcwMzYxLTUuMjcyMjI5IDIuMTE2MDY1LTQuMjc5OTUgMi4wMjA0MjMtNC4wNDA4NDdIMi4wMDg0NjhWLTUuMjcyMjI5TC4zODI1NjUtNS4xNDA3MjJWLTQuNzk0MDIyQzEuMTk1NTE3LTQuNzk0MDIyIDEuMjkxMTU4LTQuNzEwMzM2IDEuMjkxMTU4LTQuMTI0NTMzVi0uODg0NjgyQzEuMjkxMTU4LS4zNDY3IDEuMTU5NjUxLS4zNDY3IC4zODI1NjUtLjM0NjdWMEMuNjkzNC0uMDIzOTEgMS4zMzg5NzktLjAyMzkxIDEuNjczNzI0LS4wMjM5MUMyLjAyMDQyMy0uMDIzOTEgMi42NjYwMDItLjAyMzkxIDIuOTc2ODM3IDBWLS4zNDY3QzIuMjExNzA2LS4zNDY3IDIuMDY4MjQ0LS4zNDY3IDIuMDY4MjQ0LS44ODQ2ODJWLTMuMTA4MzQ0QzIuMDY4MjQ0LTQuMzYzNjM2IDIuODkzMTUxLTUuMDMzMTI2IDMuNjM0MzcxLTUuMDMzMTI2UzQuNTQyOTY0LTQuNDIzNDEyIDQuNTQyOTY0LTMuNjk0MTQ3Vi0uODg0NjgyQzQuNTQyOTY0LS4zNDY3IDQuNDExNDU3LS4zNDY3IDMuNjM0MzcxLS4zNDY3VjBDMy45NDUyMDUtLjAyMzkxIDQuNTkwNzg1LS4wMjM5MSA0LjkyNTUyOS0uMDIzOTFDNS4yNzIyMjktLjAyMzkxIDUuOTE3ODA4LS4wMjM5MSA2LjIyODY0MyAwVi0uMzQ2N0M1LjYzMDg4NC0uMzQ2NyA1LjMzMjAwNS0uMzQ2NyA1LjMyMDA1LS43MDUzNTVWLTIuOTA1MTA2WicvPgo8cGF0aCBpZD0nZzItMTA1JyBkPSdNMi4zNzUwOTMtNC45NzMzNUMyLjM3NTA5My01LjE0ODY5MiAyLjI0NzU3Mi01LjI3NjIxNCAyLjA2NDI1OS01LjI3NjIxNEMxLjg1NzAzNi01LjI3NjIxNCAxLjYyNTkwMy01LjA4NDkzMiAxLjYyNTkwMy00Ljg0NTgyOEMxLjYyNTkwMy00LjY3MDQ4NiAxLjc1MzQyNS00LjU0Mjk2NCAxLjkzNjczNy00LjU0Mjk2NEMyLjE0Mzk2LTQuNTQyOTY0IDIuMzc1MDkzLTQuNzM0MjQ3IDIuMzc1MDkzLTQuOTczMzVaTTEuMjExNDU3LTIuMDQ4MzE5TC43ODEwNzEtLjk0ODQ0M0MuNzQxMjItLjgyODg5MiAuNzAxMzctLjczMzI1IC43MDEzNy0uNTk3NzU4Qy43MDEzNy0uMjA3MjIzIDEuMDA0MjM0IC4wNzk3MDEgMS40MjY2NSAuMDc5NzAxQzIuMTk5NzUxIC4wNzk3MDEgMi41MjY1MjYtMS4wMzYxMTUgMi41MjY1MjYtMS4xMzk3MjZDMi41MjY1MjYtMS4yMTk0MjcgMi40NjI3NjUtMS4yNDMzMzcgMi40MDY5NzQtMS4yNDMzMzdDMi4zMTEzMzMtMS4yNDMzMzcgMi4yOTUzOTItMS4xODc1NDcgMi4yNzE0ODItMS4xMDc4NDZDMi4wODgxNjktLjQ3MDIzNyAxLjc2MTM5NS0uMTQzNDYyIDEuNDQyNTktLjE0MzQ2MkMxLjM0Njk0OS0uMTQzNDYyIDEuMjUxMzA4LS4xODMzMTMgMS4yNTEzMDgtLjM5ODUwNkMxLjI1MTMwOC0uNTg5Nzg4IDEuMzA3MDk4LS43MzMyNSAxLjQxMDcxLS45ODAzMjRDMS40OTA0MTEtMS4xOTU1MTcgMS41NzAxMTItMS40MTA3MSAxLjY1Nzc4My0xLjYyNTkwM0wxLjkwNDg1Ny0yLjI3MTQ4MkMxLjk3NjU4OC0yLjQ1NDc5NSAyLjA3MjIyOS0yLjcwMTg2OCAyLjA3MjIyOS0yLjgzNzM2QzIuMDcyMjI5LTMuMjM1ODY2IDEuNzUzNDI1LTMuNTE0ODE5IDEuMzQ2OTQ5LTMuNTE0ODE5Qy41NzM4NDgtMy41MTQ4MTkgLjIzOTEwMy0yLjM5OTAwNCAuMjM5MTAzLTIuMjk1MzkyQy4yMzkxMDMtMi4yMjM2NjEgLjI5NDg5NC0yLjE5MTc4MSAuMzU4NjU1LTIuMTkxNzgxQy40NjIyNjctMi4xOTE3ODEgLjQ3MDIzNy0yLjIzOTYwMSAuNDk0MTQ3LTIuMzE5MzAzQy43MTczMS0zLjA3NjQ2MyAxLjA4MzkzNS0zLjI5MTY1NiAxLjMyMzAzOS0zLjI5MTY1NkMxLjQzNDYyLTMuMjkxNjU2IDEuNTE0MzIxLTMuMjUxODA2IDEuNTE0MzIxLTMuMDI4NjQzQzEuNTE0MzIxLTIuOTQ4OTQxIDEuNTA2MzUxLTIuODM3MzYgMS40MjY2NS0yLjU5ODI1N0wxLjIxMTQ1Ny0yLjA0ODMxOVonLz4KPHBhdGggaWQ9J2cyLTEwNicgZD0nTTMuMjkxNjU2LTQuOTczMzVDMy4yOTE2NTYtNS4xMjQ3ODIgMy4xNzIxMDUtNS4yNzYyMTQgMi45ODA4MjItNS4yNzYyMTRDMi43NDE3MTktNS4yNzYyMTQgMi41MzQ0OTYtNS4wNTMwNTEgMi41MzQ0OTYtNC44NDU4MjhDMi41MzQ0OTYtNC42OTQzOTYgMi42NTQwNDctNC41NDI5NjQgMi44NDUzMy00LjU0Mjk2NEMzLjA4NDQzMy00LjU0Mjk2NCAzLjI5MTY1Ni00Ljc2NjEyNyAzLjI5MTY1Ni00Ljk3MzM1Wk0xLjYyNTkwMyAuMzk4NTA2QzEuNTA2MzUxIC44ODQ2ODIgMS4xMTU4MTYgMS40MDI3NCAuNjI5NjM5IDEuNDAyNzRDLjUwMjExNyAxLjQwMjc0IC4zODI1NjUgMS4zNzA4NTkgLjM2NjYyNSAxLjM2Mjg4OUMuNjEzNjk5IDEuMjQzMzM3IC42NDU1NzkgMS4wMjgxNDQgLjY0NTU3OSAuOTU2NDEzQy42NDU1NzkgLjc2NTEzMSAuNTAyMTE3IC42NjE1MTkgLjMzNDc0NSAuNjYxNTE5Qy4xMDM2MTEgLjY2MTUxOS0uMTExNTgyIC44NjA3NzItLjExMTU4MiAxLjEyMzc4NkMtLjExMTU4MiAxLjQyNjY1IC4xODMzMTMgMS42MjU5MDMgLjYzNzYwOSAxLjYyNTkwM0MxLjEyMzc4NiAxLjYyNTkwMyAyLjAwMDQ5OCAxLjMyMzAzOSAyLjIzOTYwMSAuMzY2NjI1TDIuOTU2OTEyLTIuNDg2Njc1QzIuOTgwODIyLTIuNTgyMzE2IDIuOTk2NzYyLTIuNjQ2MDc3IDIuOTk2NzYyLTIuNzY1NjI5QzIuOTk2NzYyLTMuMjAzOTg1IDIuNjQ2MDc3LTMuNTE0ODE5IDIuMTgzODExLTMuNTE0ODE5QzEuMzM4OTc5LTMuNTE0ODE5IC44NDQ4MzItMi4zOTkwMDQgLjg0NDgzMi0yLjI5NTM5MkMuODQ0ODMyLTIuMjIzNjYxIC45MDA2MjMtMi4xOTE3ODEgLjk2NDM4NC0yLjE5MTc4MUMxLjA1MjA1NS0yLjE5MTc4MSAxLjA2MDAyNS0yLjIxNTY5MSAxLjExNTgxNi0yLjMzNTI0M0MxLjM1NDkxOS0yLjg4NTE4MSAxLjc2MTM5NS0zLjI5MTY1NiAyLjE1OTktMy4yOTE2NTZDMi4zMjcyNzMtMy4yOTE2NTYgMi40MjI5MTQtMy4xODAwNzUgMi40MjI5MTQtMi45MTcwNjFDMi40MjI5MTQtMi44MDU0NzkgMi4zOTkwMDQtMi42OTM4OTggMi4zNzUwOTMtMi41ODIzMTZMMS42MjU5MDMgLjM5ODUwNlonLz4KPHBhdGggaWQ9J2cxLTAnIGQ9J003Ljg3ODQ1Ni0yLjc0OTY4OUM4LjA4MTY5NC0yLjc0OTY4OSA4LjI5Njg4Ny0yLjc0OTY4OSA4LjI5Njg4Ny0yLjk4ODc5MlM4LjA4MTY5NC0zLjIyNzg5NSA3Ljg3ODQ1Ni0zLjIyNzg5NUgxLjQxMDcxQzEuMjA3NDcyLTMuMjI3ODk1IC45OTIyNzktMy4yMjc4OTUgLjk5MjI3OS0yLjk4ODc5MlMxLjIwNzQ3Mi0yLjc0OTY4OSAxLjQxMDcxLTIuNzQ5Njg5SDcuODc4NDU2WicvPgo8cGF0aCBpZD0nZzEtMjAnIGQ9J004LjA2OTczOC03LjEwMTM3QzguMjAxMjQ1LTcuMTYxMTQ2IDguMjk2ODg3LTcuMjIwOTIyIDguMjk2ODg3LTcuMzY0Mzg0QzguMjk2ODg3LTcuNDk1ODkgOC4yMDEyNDUtNy42MDM0ODcgOC4wNTc3ODMtNy42MDM0ODdDNy45OTgwMDctNy42MDM0ODcgNy44OTA0MTEtNy41NTU2NjYgNy44NDI1OS03LjUzMTc1NkwxLjIzMTM4Mi00LjQxMTQ1N0MxLjAyODE0NC00LjMxNTgxNiAuOTkyMjc5LTQuMjMyMTMgLjk5MjI3OS00LjEzNjQ4OEMuOTkyMjc5LTQuMDI4ODkyIDEuMDY0MDEtMy45NDUyMDUgMS4yMzEzODItMy44NzM0NzRMNy44NDI1OS0uNzY1MTMxQzcuOTk4MDA3LS42ODE0NDUgOC4wMjE5MTgtLjY4MTQ0NSA4LjA1Nzc4My0uNjgxNDQ1QzguMTg5MjktLjY4MTQ0NSA4LjI5Njg4Ny0uNzg5MDQxIDguMjk2ODg3LS45MjA1NDhDOC4yOTY4ODctMS4wMjgxNDQgOC4yNDkwNjYtMS4wOTk4NzUgOC4wNDU4MjgtMS4xOTU1MTdMMS43OTMyNzUtNC4xMzY0ODhMOC4wNjk3MzgtNy4xMDEzN1pNNy44Nzg0NTYgMS42Mzc4NThDOC4wODE2OTQgMS42Mzc4NTggOC4yOTY4ODcgMS42Mzc4NTggOC4yOTY4ODcgMS4zOTg3NTVTOC4wNDU4MjggMS4xNTk2NTEgNy44NjY1MDEgMS4xNTk2NTFIMS40MjI2NjVDMS4yNDMzMzcgMS4xNTk2NTEgLjk5MjI3OSAxLjE1OTY1MSAuOTkyMjc5IDEuMzk4NzU1UzEuMjA3NDcyIDEuNjM3ODU4IDEuNDEwNzEgMS42Mzc4NThINy44Nzg0NTZaJy8+CjxwYXRoIGlkPSdnMS01MCcgZD0nTTYuNTUxNDMyLTIuNzQ5Njg5QzYuNzU0NjctMi43NDk2ODkgNi45Njk4NjMtMi43NDk2ODkgNi45Njk4NjMtMi45ODg3OTJTNi43NTQ2Ny0zLjIyNzg5NSA2LjU1MTQzMi0zLjIyNzg5NUgxLjQ4MjQ0MUMxLjYyNTkwMy00LjgyOTg4OCAzLjAwMDc0Ny01Ljk3NzU4NCA0LjY4NjQyNi01Ljk3NzU4NEg2LjU1MTQzMkM2Ljc1NDY3LTUuOTc3NTg0IDYuOTY5ODYzLTUuOTc3NTg0IDYuOTY5ODYzLTYuMjE2Njg3UzYuNzU0NjctNi40NTU3OTEgNi41NTE0MzItNi40NTU3OTFINC42NjI1MTZDMi42MTgxODItNi40NTU3OTEgLjk5MjI3OS00LjkwMTYxOSAuOTkyMjc5LTIuOTg4NzkyUzIuNjE4MTgyIC40NzgyMDcgNC42NjI1MTYgLjQ3ODIwN0g2LjU1MTQzMkM2Ljc1NDY3IC40NzgyMDcgNi45Njk4NjMgLjQ3ODIwNyA2Ljk2OTg2MyAuMjM5MTAzUzYuNzU0NjcgMCA2LjU1MTQzMiAwSDQuNjg2NDI2QzMuMDAwNzQ3IDAgMS42MjU5MDMtMS4xNDc2OTYgMS40ODI0NDEtMi43NDk2ODlINi41NTE0MzJaJy8+CjxwYXRoIGlkPSdnMS01NCcgZD0nTTcuNTMxNzU2LTguMDkzNjQ5QzcuNjI3Mzk3LTguMjYxMDIxIDcuNjI3Mzk3LTguMjg0OTMyIDcuNjI3Mzk3LTguMzIwNzk3QzcuNjI3Mzk3LTguNDA0NDgzIDcuNTU1NjY2LTguNTU5OSA3LjM4ODI5NC04LjU1OTlDNy4yNDQ4MzItOC41NTk5IDcuMjA4OTY2LTguNDg4MTY5IDcuMTI1MjgtOC4zMjA3OTdMMS43NTc0MSAyLjExNjA2NUMxLjY2MTc2OCAyLjI4MzQzNyAxLjY2MTc2OCAyLjMwNzM0NyAxLjY2MTc2OCAyLjM0MzIxM0MxLjY2MTc2OCAyLjQzODg1NCAxLjc0NTQ1NSAyLjU4MjMxNiAxLjkwMDg3MiAyLjU4MjMxNkMyLjA0NDMzNCAyLjU4MjMxNiAyLjA4MDE5OSAyLjUxMDU4NSAyLjE2Mzg4NSAyLjM0MzIxM0w3LjUzMTc1Ni04LjA5MzY0OVonLz4KPHBhdGggaWQ9J2cxLTEwNicgZD0nTTEuOTAwODcyLTguNTM1OTlDMS45MDA4NzItOC43NTExODMgMS45MDA4NzItOC45NjYzNzYgMS42NjE3NjgtOC45NjYzNzZTMS40MjI2NjUtOC43NTExODMgMS40MjI2NjUtOC41MzU5OVYyLjU1ODQwNkMxLjQyMjY2NSAyLjc3MzU5OSAxLjQyMjY2NSAyLjk4ODc5MiAxLjY2MTc2OCAyLjk4ODc5MlMxLjkwMDg3MiAyLjc3MzU5OSAxLjkwMDg3MiAyLjU1ODQwNlYtOC41MzU5OVonLz4KPHBhdGggaWQ9J2czLTU5JyBkPSdNMi4zMzEyNTggLjA0NzgyMUMyLjMzMTI1OC0uNjQ1NTc5IDIuMTA0MTEtMS4xNTk2NTEgMS42MTM5NDgtMS4xNTk2NTFDMS4yMzEzODItMS4xNTk2NTEgMS4wNDAxLS44NDg4MTcgMS4wNDAxLS41ODU4MDNTMS4yMTk0MjcgMCAxLjYyNTkwMyAwQzEuNzgxMzIgMCAxLjkxMjgyNy0uMDQ3ODIxIDIuMDIwNDIzLS4xNTU0MTdDMi4wNDQzMzQtLjE3OTMyOCAyLjA1NjI4OS0uMTc5MzI4IDIuMDY4MjQ0LS4xNzkzMjhDMi4wOTIxNTQtLjE3OTMyOCAyLjA5MjE1NC0uMDExOTU1IDIuMDkyMTU0IC4wNDc4MjFDMi4wOTIxNTQgLjQ0MjM0MSAyLjAyMDQyMyAxLjIxOTQyNyAxLjMyNzAyNCAxLjk5NjUxM0MxLjE5NTUxNyAyLjEzOTk3NSAxLjE5NTUxNyAyLjE2Mzg4NSAxLjE5NTUxNyAyLjE4Nzc5NkMxLjE5NTUxNyAyLjI0NzU3MiAxLjI1NTI5MyAyLjMwNzM0NyAxLjMxNTA2OCAyLjMwNzM0N0MxLjQxMDcxIDIuMzA3MzQ3IDIuMzMxMjU4IDEuNDIyNjY1IDIuMzMxMjU4IC4wNDc4MjFaJy8+CjxwYXRoIGlkPSdnMy02NycgZD0nTTguOTMwNTExLTguMzA4ODQyQzguOTMwNTExLTguNDE2NDM4IDguODQ2ODI0LTguNDE2NDM4IDguODIyOTE0LTguNDE2NDM4UzguNzUxMTgzLTguNDE2NDM4IDguNjU1NTQyLTguMjk2ODg3TDcuODMwNjM1LTcuMjkyNjUzQzcuNDEyMjA0LTguMDA5OTYzIDYuNzU0NjctOC40MTY0MzggNS44NTgwMzItOC40MTY0MzhDMy4yNzU3MTYtOC40MTY0MzggLjU5Nzc1OC01Ljc5ODI1NyAuNTk3NzU4LTIuOTg4NzkyQy41OTc3NTgtLjk5MjI3OSAxLjk5NjUxMyAuMjUxMDU5IDMuNzQxOTY4IC4yNTEwNTlDNC42OTgzODEgLjI1MTA1OSA1LjUzNTI0My0uMTU1NDE3IDYuMjI4NjQzLS43NDEyMkM3LjI2ODc0Mi0xLjYxMzk0OCA3LjU3OTU3Ny0yLjc3MzU5OSA3LjU3OTU3Ny0yLjg2OTI0QzcuNTc5NTc3LTIuOTc2ODM3IDcuNDgzOTM1LTIuOTc2ODM3IDcuNDQ4MDctMi45NzY4MzdDNy4zNDA0NzMtMi45NzY4MzcgNy4zMjg1MTgtMi45MDUxMDYgNy4zMDQ2MDgtMi44NTcyODVDNi43NTQ2Ny0uOTkyMjc5IDUuMTQwNzIyLS4wOTU2NDEgMy45NDUyMDUtLjA5NTY0MUMyLjY3Nzk1OC0uMDk1NjQxIDEuNTc4MDgyLS45MDg1OTMgMS41NzgwODItMi42MDYyMjdDMS41NzgwODItMi45ODg3OTIgMS42OTc2MzQtNS4wNjg5OTEgMy4wNDg1NjgtNi42MzUxMThDMy43MDYxMDItNy40MDAyNDkgNC44Mjk4ODgtOC4wNjk3MzggNS45NjU2MjktOC4wNjk3MzhDNy4yODA2OTctOC4wNjk3MzggNy44NjY1MDEtNi45ODE4MTggNy44NjY1MDEtNS43NjIzOTFDNy44NjY1MDEtNS40NTE1NTcgNy44MzA2MzUtNS4xODg1NDMgNy44MzA2MzUtNS4xNDA3MjJDNy44MzA2MzUtNS4wMzMxMjYgNy45NTAxODctNS4wMzMxMjYgNy45ODYwNTItNS4wMzMxMjZDOC4xMTc1NTktNS4wMzMxMjYgOC4xMjk1MTQtNS4wNDUwODEgOC4xNzczMzUtNS4yNjAyNzRMOC45MzA1MTEtOC4zMDg4NDJaJy8+CjxwYXRoIGlkPSdnMy04OCcgZD0nTTUuNjc4NzA1LTQuODUzNzk4TDQuNTU0OTE5LTcuNDcxOThDNC43MTAzMzYtNy43NTg5MDQgNS4wNjg5OTEtNy44MDY3MjUgNS4yMTI0NTMtNy44MTg2OEM1LjI4NDE4NC03LjgxODY4IDUuNDE1NjkxLTcuODMwNjM1IDUuNDE1NjkxLTguMDMzODczQzUuNDE1NjkxLTguMTY1MzggNS4zMDgwOTUtOC4xNjUzOCA1LjIzNjM2NC04LjE2NTM4QzUuMDMzMTI2LTguMTY1MzggNC43OTQwMjItOC4xNDE0NjkgNC41OTA3ODUtOC4xNDE0NjlIMy44OTczODVDMy4xNjgxMi04LjE0MTQ2OSAyLjY0MjA5Mi04LjE2NTM4IDIuNjMwMTM3LTguMTY1MzhDMi41MzQ0OTYtOC4xNjUzOCAyLjQxNDk0NC04LjE2NTM4IDIuNDE0OTQ0LTcuOTM4MjMyQzIuNDE0OTQ0LTcuODE4NjggMi41MjI1NC03LjgxODY4IDIuNjc3OTU4LTcuODE4NjhDMy4zNzEzNTctNy44MTg2OCAzLjQxOTE3OC03LjY5OTEyOCAzLjUzODczLTcuNDEyMjA0TDQuOTYxMzk1LTQuMDg4NjY3TDIuMzY3MTIzLTEuMzE1MDY4QzEuOTM2NzM3LS44NDg4MTcgMS40MjI2NjUtLjM5NDUyMSAuNTM3OTgzLS4zNDY3Qy4zOTQ1MjEtLjMzNDc0NSAuMjk4ODc5LS4zMzQ3NDUgLjI5ODg3OS0uMTE5NTUyQy4yOTg4NzktLjA4MzY4NiAuMzEwODM0IDAgLjQ0MjM0MSAwQy42MDk3MTQgMCAuNzg5MDQxLS4wMjM5MSAuOTU2NDEzLS4wMjM5MUgxLjUxODMwNkMxLjkwMDg3Mi0uMDIzOTEgMi4zMTkzMDMgMCAyLjY4OTkxMyAwQzIuNzczNTk5IDAgMi45MTcwNjEgMCAyLjkxNzA2MS0uMjE1MTkzQzIuOTE3MDYxLS4zMzQ3NDUgMi44MzMzNzUtLjM0NjcgMi43NjE2NDQtLjM0NjdDMi41MjI1NC0uMzcwNjEgMi4zNjcxMjMtLjUwMjExNyAyLjM2NzEyMy0uNjkzNEMyLjM2NzEyMy0uODk2NjM4IDIuNTEwNTg1LTEuMDQwMSAyLjg1NzI4NS0xLjM5ODc1NUwzLjkyMTI5NS0yLjU1ODQwNkM0LjE4NDMwOS0yLjgzMzM3NSA0LjgxNzkzMy0zLjUyNjc3NSA1LjA4MDk0Ni0zLjc4OTc4OEw2LjMzNjIzOS0uODQ4ODE3QzYuMzQ4MTk0LS44MjQ5MDcgNi4zOTYwMTUtLjcwNTM1NSA2LjM5NjAxNS0uNjkzNEM2LjM5NjAxNS0uNTg1ODAzIDYuMTMzMDAxLS4zNzA2MSA1Ljc1MDQzNi0uMzQ2N0M1LjY3ODcwNS0uMzQ2NyA1LjU0NzE5OC0uMzM0NzQ1IDUuNTQ3MTk4LS4xMTk1NTJDNS41NDcxOTggMCA1LjY2Njc1IDAgNS43MjY1MjYgMEM1LjkyOTc2MyAwIDYuMTY4ODY3LS4wMjM5MSA2LjM3MjEwNS0uMDIzOTFINy42ODcxNzNDNy45MDIzNjYtLjAyMzkxIDguMTI5NTE0IDAgOC4zMzI3NTIgMEM4LjQxNjQzOCAwIDguNTQ3OTQ1IDAgOC41NDc5NDUtLjIyNzE0OEM4LjU0Nzk0NS0uMzQ2NyA4LjQyODM5NC0uMzQ2NyA4LjMyMDc5Ny0uMzQ2N0M3LjYwMzQ4Ny0uMzU4NjU1IDcuNTc5NTc3LS40MTg0MzEgNy4zNzYzMzktLjg2MDc3Mkw1Ljc5ODI1Ny00LjU2Njg3NEw3LjMxNjU2My02LjE5Mjc3N0M3LjQzNjExNS02LjMxMjMyOSA3LjcxMTA4My02LjYxMTIwOCA3LjgxODY4LTYuNzMwNzZDOC4zMzI3NTItNy4yNjg3NDIgOC44MTA5NTktNy43NTg5MDQgOS43NzkzMjgtNy44MTg2OEM5Ljg5ODg3OS03LjgzMDYzNSAxMC4wMTg0MzEtNy44MzA2MzUgMTAuMDE4NDMxLTguMDMzODczQzEwLjAxODQzMS04LjE2NTM4IDkuOTEwODM0LTguMTY1MzggOS44NjMwMTQtOC4xNjUzOEM5LjY5NTY0MS04LjE2NTM4IDkuNTE2MzE0LTguMTQxNDY5IDkuMzQ4OTQxLTguMTQxNDY5SDguNzk5MDA0QzguNDE2NDM4LTguMTQxNDY5IDcuOTk4MDA3LTguMTY1MzggNy42MjczOTctOC4xNjUzOEM3LjU0MzcxMS04LjE2NTM4IDcuNDAwMjQ5LTguMTY1MzggNy40MDAyNDktNy45NTAxODdDNy40MDAyNDktNy44MzA2MzUgNy40ODM5MzUtNy44MTg2OCA3LjU1NTY2Ni03LjgxODY4QzcuNzQ2OTQ5LTcuNzk0NzcgNy45NTAxODctNy42OTkxMjggNy45NTAxODctNy40NzE5OEw3LjkzODIzMi03LjQ0ODA3QzcuOTI2Mjc2LTcuMzY0Mzg0IDcuOTAyMzY2LTcuMjQ0ODMyIDcuNzcwODU5LTcuMTAxMzdMNS42Nzg3MDUtNC44NTM3OThaJy8+CjxwYXRoIGlkPSdnMy05NycgZD0nTTMuNTk4NTA2LTEuNDIyNjY1QzMuNTM4NzMtMS4yMTk0MjcgMy41Mzg3My0xLjE5NTUxNyAzLjM3MTM1Ny0uOTY4MzY5QzMuMTA4MzQ0LS42MzM2MjQgMi41ODIzMTYtLjExOTU1MiAyLjAyMDQyMy0uMTE5NTUyQzEuNTMwMjYyLS4xMTk1NTIgMS4yNTUyOTMtLjU2MTg5MyAxLjI1NTI5My0xLjI2NzI0OEMxLjI1NTI5My0xLjkyNDc4MiAxLjYyNTkwMy0zLjI2Mzc2MSAxLjg1MzA1MS0zLjc2NTg3OEMyLjI1OTUyNy00LjYwMjc0IDIuODIxNDItNS4wMzMxMjYgMy4yODc2NzEtNS4wMzMxMjZDNC4wNzY3MTItNS4wMzMxMjYgNC4yMzIxMy00LjA1MjgwMiA0LjIzMjEzLTMuOTU3MTYxQzQuMjMyMTMtMy45NDUyMDUgNC4xOTYyNjQtMy43ODk3ODggNC4xODQzMDktMy43NjU4NzhMMy41OTg1MDYtMS40MjI2NjVaTTQuMzYzNjM2LTQuNDgzMTg4QzQuMjMyMTMtNC43OTQwMjIgMy45MDkzNC01LjI3MjIyOSAzLjI4NzY3MS01LjI3MjIyOUMxLjkzNjczNy01LjI3MjIyOSAuNDc4MjA3LTMuNTI2Nzc1IC40NzgyMDctMS43NTc0MUMuNDc4MjA3LS41NzM4NDggMS4xNzE2MDYgLjExOTU1MiAxLjk4NDU1OCAuMTE5NTUyQzIuNjQyMDkyIC4xMTk1NTIgMy4yMDM5ODUtLjM5NDUyMSAzLjUzODczLS43ODkwNDFDMy42NTgyODEtLjA4MzY4NiA0LjIyMDE3NCAuMTE5NTUyIDQuNTc4ODI5IC4xMTk1NTJTNS4yMjQ0MDgtLjA5NTY0MSA1LjQzOTYwMS0uNTI2MDI3QzUuNjMwODg0LS45MzI1MDMgNS43OTgyNTctMS42NjE3NjggNS43OTgyNTctMS43MDk1ODlDNS43OTgyNTctMS43NjkzNjUgNS43NTA0MzYtMS44MTcxODYgNS42Nzg3MDUtMS44MTcxODZDNS41NzExMDgtMS44MTcxODYgNS41NTkxNTMtMS43NTc0MSA1LjUxMTMzMy0xLjU3ODA4MkM1LjMzMjAwNS0uODcyNzI3IDUuMTA0ODU3LS4xMTk1NTIgNC42MTQ2OTUtLjExOTU1MkM0LjI2Nzk5NS0uMTE5NTUyIDQuMjQ0MDg1LS40MzAzODYgNC4yNDQwODUtLjY2OTQ4OUM0LjI0NDA4NS0uOTQ0NDU4IDQuMjc5OTUtMS4wNzU5NjUgNC4zODc1NDctMS41NDIyMTdDNC40NzEyMzMtMS44NDEwOTYgNC41MzEwMDktMi4xMDQxMSA0LjYyNjY1LTIuNDUwODA5QzUuMDY4OTkxLTQuMjQ0MDg1IDUuMTc2NTg4LTQuNjc0NDcxIDUuMTc2NTg4LTQuNzQ2MjAyQzUuMTc2NTg4LTQuOTEzNTc0IDUuMDQ1MDgxLTUuMDQ1MDgxIDQuODY1NzUzLTUuMDQ1MDgxQzQuNDgzMTg4LTUuMDQ1MDgxIDQuMzg3NTQ3LTQuNjI2NjUgNC4zNjM2MzYtNC40ODMxODhaJy8+CjxwYXRoIGlkPSdnMy0xMDAnIGQ9J002LjAxMzQ1LTcuOTk4MDA3QzYuMDI1NDA1LTguMDQ1ODI4IDYuMDQ5MzE1LTguMTE3NTU5IDYuMDQ5MzE1LTguMTc3MzM1QzYuMDQ5MzE1LTguMjk2ODg3IDUuOTI5NzYzLTguMjk2ODg3IDUuOTA1ODUzLTguMjk2ODg3QzUuODkzODk4LTguMjk2ODg3IDUuMzA4MDk1LTguMjQ5MDY2IDUuMjQ4MzE5LTguMjM3MTExQzUuMDQ1MDgxLTguMjI1MTU2IDQuODY1NzUzLTguMjAxMjQ1IDQuNjUwNTYtOC4xODkyOUM0LjM1MTY4MS04LjE2NTM4IDQuMjY3OTk1LTguMTUzNDI1IDQuMjY3OTk1LTcuOTM4MjMyQzQuMjY3OTk1LTcuODE4NjggNC4zNjM2MzYtNy44MTg2OCA0LjUzMTAwOS03LjgxODY4QzUuMTE2ODEyLTcuODE4NjggNS4xMjg3NjctNy43MTEwODMgNS4xMjg3NjctNy41OTE1MzJDNS4xMjg3NjctNy41MTk4MDEgNS4xMDQ4NTctNy40MjQxNTkgNS4wOTI5MDItNy4zODgyOTRMNC4zNjM2MzYtNC40ODMxODhDNC4yMzIxMy00Ljc5NDAyMiAzLjkwOTM0LTUuMjcyMjI5IDMuMjg3NjcxLTUuMjcyMjI5QzEuOTM2NzM3LTUuMjcyMjI5IC40NzgyMDctMy41MjY3NzUgLjQ3ODIwNy0xLjc1NzQxQy40NzgyMDctLjU3Mzg0OCAxLjE3MTYwNiAuMTE5NTUyIDEuOTg0NTU4IC4xMTk1NTJDMi42NDIwOTIgLjExOTU1MiAzLjIwMzk4NS0uMzk0NTIxIDMuNTM4NzMtLjc4OTA0MUMzLjY1ODI4MS0uMDgzNjg2IDQuMjIwMTc0IC4xMTk1NTIgNC41Nzg4MjkgLjExOTU1MlM1LjIyNDQwOC0uMDk1NjQxIDUuNDM5NjAxLS41MjYwMjdDNS42MzA4ODQtLjkzMjUwMyA1Ljc5ODI1Ny0xLjY2MTc2OCA1Ljc5ODI1Ny0xLjcwOTU4OUM1Ljc5ODI1Ny0xLjc2OTM2NSA1Ljc1MDQzNi0xLjgxNzE4NiA1LjY3ODcwNS0xLjgxNzE4NkM1LjU3MTEwOC0xLjgxNzE4NiA1LjU1OTE1My0xLjc1NzQxIDUuNTExMzMzLTEuNTc4MDgyQzUuMzMyMDA1LS44NzI3MjcgNS4xMDQ4NTctLjExOTU1MiA0LjYxNDY5NS0uMTE5NTUyQzQuMjY3OTk1LS4xMTk1NTIgNC4yNDQwODUtLjQzMDM4NiA0LjI0NDA4NS0uNjY5NDg5QzQuMjQ0MDg1LS43MTczMSA0LjI0NDA4NS0uOTY4MzY5IDQuMzI3NzcxLTEuMzAzMTEzTDYuMDEzNDUtNy45OTgwMDdaTTMuNTk4NTA2LTEuNDIyNjY1QzMuNTM4NzMtMS4yMTk0MjcgMy41Mzg3My0xLjE5NTUxNyAzLjM3MTM1Ny0uOTY4MzY5QzMuMTA4MzQ0LS42MzM2MjQgMi41ODIzMTYtLjExOTU1MiAyLjAyMDQyMy0uMTE5NTUyQzEuNTMwMjYyLS4xMTk1NTIgMS4yNTUyOTMtLjU2MTg5MyAxLjI1NTI5My0xLjI2NzI0OEMxLjI1NTI5My0xLjkyNDc4MiAxLjYyNTkwMy0zLjI2Mzc2MSAxLjg1MzA1MS0zLjc2NTg3OEMyLjI1OTUyNy00LjYwMjc0IDIuODIxNDItNS4wMzMxMjYgMy4yODc2NzEtNS4wMzMxMjZDNC4wNzY3MTItNS4wMzMxMjYgNC4yMzIxMy00LjA1MjgwMiA0LjIzMjEzLTMuOTU3MTYxQzQuMjMyMTMtMy45NDUyMDUgNC4xOTYyNjQtMy43ODk3ODggNC4xODQzMDktMy43NjU4NzhMMy41OTg1MDYtMS40MjI2NjVaJy8+CjxwYXRoIGlkPSdnMy0xMDQnIGQ9J00zLjM1OTQwMi03Ljk5ODAwN0MzLjM3MTM1Ny04LjA0NTgyOCAzLjM5NTI2OC04LjExNzU1OSAzLjM5NTI2OC04LjE3NzMzNUMzLjM5NTI2OC04LjI5Njg4NyAzLjI3NTcxNi04LjI5Njg4NyAzLjI1MTgwNi04LjI5Njg4N0MzLjIzOTg1MS04LjI5Njg4NyAyLjY1NDA0Ny04LjI0OTA2NiAyLjU5NDI3MS04LjIzNzExMUMyLjM5MTAzNC04LjIyNTE1NiAyLjIxMTcwNi04LjIwMTI0NSAxLjk5NjUxMy04LjE4OTI5QzEuNjk3NjM0LTguMTY1MzggMS42MTM5NDgtOC4xNTM0MjUgMS42MTM5NDgtNy45MzgyMzJDMS42MTM5NDgtNy44MTg2OCAxLjcwOTU4OS03LjgxODY4IDEuODc2OTYxLTcuODE4NjhDMi40NjI3NjUtNy44MTg2OCAyLjQ3NDcyLTcuNzExMDgzIDIuNDc0NzItNy41OTE1MzJDMi40NzQ3Mi03LjUxOTgwMSAyLjQ1MDgwOS03LjQyNDE1OSAyLjQzODg1NC03LjM4ODI5NEwuNzA1MzU1LS40NjYyNTJDLjY1NzUzNC0uMjg2OTI0IC42NTc1MzQtLjI2MzAxNCAuNjU3NTM0LS4xOTEyODNDLjY1NzUzNCAuMDcxNzMxIC44NjA3NzIgLjExOTU1MiAuOTgwMzI0IC4xMTk1NTJDMS4xODM1NjIgLjExOTU1MiAxLjMzODk3OS0uMDM1ODY2IDEuMzk4NzU1LS4xNjczNzJMMS45MzY3MzctMi4zMzEyNThDMS45OTY1MTMtMi41OTQyNzEgMi4wNjgyNDQtMi44NDUzMyAyLjEyODAyLTMuMTA4MzQ0QzIuMjU5NTI3LTMuNjEwNDYxIDIuMjU5NTI3LTMuNjIyNDE2IDIuNDg2Njc1LTMuOTY5MTE2UzMuMjUxODA2LTUuMDMzMTI2IDQuMTcyMzU0LTUuMDMzMTI2QzQuNjUwNTYtNS4wMzMxMjYgNC44MTc5MzMtNC42NzQ0NzEgNC44MTc5MzMtNC4xOTYyNjRDNC44MTc5MzMtMy41MjY3NzUgNC4zNTE2ODEtMi4yMjM2NjEgNC4wODg2NjctMS41MDYzNTFDMy45ODEwNzEtMS4yMTk0MjcgMy45MjEyOTUtMS4wNjQwMSAzLjkyMTI5NS0uODQ4ODE3QzMuOTIxMjk1LS4zMTA4MzQgNC4yOTE5MDUgLjExOTU1MiA0Ljg2NTc1MyAuMTE5NTUyQzUuOTc3NTg0IC4xMTk1NTIgNi4zOTYwMTUtMS42Mzc4NTggNi4zOTYwMTUtMS43MDk1ODlDNi4zOTYwMTUtMS43NjkzNjUgNi4zNDgxOTQtMS44MTcxODYgNi4yNzY0NjMtMS44MTcxODZDNi4xNjg4NjctMS44MTcxODYgNi4xNTY5MTItMS43ODEzMiA2LjA5NzEzNi0xLjU3ODA4MkM1LjgyMjE2Ny0uNjIxNjY5IDUuMzc5ODI2LS4xMTk1NTIgNC45MDE2MTktLjExOTU1MkM0Ljc4MjA2Ny0uMTE5NTUyIDQuNTkwNzg1LS4xMzE1MDcgNC41OTA3ODUtLjUxNDA3MkM0LjU5MDc4NS0uODI0OTA3IDQuNzM0MjQ3LTEuMjA3NDcyIDQuNzgyMDY3LTEuMzM4OTc5QzQuOTk3MjYtMS45MTI4MjcgNS41MzUyNDMtMy4zMjM1MzcgNS41MzUyNDMtNC4wMTY5MzZDNS41MzUyNDMtNC43MzQyNDcgNS4xMTY4MTItNS4yNzIyMjkgNC4yMDgyMTktNS4yNzIyMjlDMy41MjY3NzUtNS4yNzIyMjkgMi45MjkwMTYtNC45NDk0NCAyLjQzODg1NC00LjMyNzc3MUwzLjM1OTQwMi03Ljk5ODAwN1onLz4KPHBhdGggaWQ9J2czLTEwNScgZD0nTTMuMzgzMzEzLTEuNzA5NTg5QzMuMzgzMzEzLTEuNzY5MzY1IDMuMzM1NDkyLTEuODE3MTg2IDMuMjYzNzYxLTEuODE3MTg2QzMuMTU2MTY0LTEuODE3MTg2IDMuMTQ0MjA5LTEuNzgxMzIgMy4wODQ0MzMtMS41NzgwODJDMi43NzM1OTktLjQ5MDE2MiAyLjI4MzQzNy0uMTE5NTUyIDEuODg4OTE3LS4xMTk1NTJDMS43NDU0NTUtLjExOTU1MiAxLjU3ODA4Mi0uMTU1NDE3IDEuNTc4MDgyLS41MTQwNzJDMS41NzgwODItLjgzNjg2MiAxLjcyMTU0NC0xLjE5NTUxNyAxLjg1MzA1MS0xLjU1NDE3MkwyLjY4OTkxMy0zLjc3NzgzM0MyLjcyNTc3OC0zLjg3MzQ3NCAyLjgwOTQ2NS00LjA4ODY2NyAyLjgwOTQ2NS00LjMxNTgxNkMyLjgwOTQ2NS00LjgxNzkzMyAyLjQ1MDgwOS01LjI3MjIyOSAxLjg2NTAwNi01LjI3MjIyOUMuNzY1MTMxLTUuMjcyMjI5IC4zMjI3OS0zLjUzODczIC4zMjI3OS0zLjQ0MzA4OEMuMzIyNzktMy4zOTUyNjggLjM3MDYxLTMuMzM1NDkyIC40NTQyOTYtMy4zMzU0OTJDLjU2MTg5My0zLjMzNTQ5MiAuNTczODQ4LTMuMzgzMzEzIC42MjE2NjktMy41NTA2ODVDLjkwODU5My00LjU1NDkxOSAxLjM2Mjg4OS01LjAzMzEyNiAxLjgyOTE0MS01LjAzMzEyNkMxLjkzNjczNy01LjAzMzEyNiAyLjEzOTk3NS01LjAyMTE3MSAyLjEzOTk3NS00LjYzODYwNUMyLjEzOTk3NS00LjMyNzc3MSAxLjk4NDU1OC0zLjkzMzI1IDEuODg4OTE3LTMuNjcwMjM3TDEuMDUyMDU1LTEuNDQ2NTc1Qy45ODAzMjQtMS4yNTUyOTMgLjkwODU5My0xLjA2NDAxIC45MDg1OTMtLjg0ODgxN0MuOTA4NTkzLS4zMTA4MzQgMS4yNzkyMDMgLjExOTU1MiAxLjg1MzA1MSAuMTE5NTUyQzIuOTUyOTI3IC4xMTk1NTIgMy4zODMzMTMtMS42MjU5MDMgMy4zODMzMTMtMS43MDk1ODlaTTMuMjg3NjcxLTcuNDYwMDI1QzMuMjg3NjcxLTcuNjM5MzUyIDMuMTQ0MjA5LTcuODU0NTQ1IDIuODgxMTk2LTcuODU0NTQ1QzIuNjA2MjI3LTcuODU0NTQ1IDIuMjk1MzkyLTcuNTkxNTMyIDIuMjk1MzkyLTcuMjgwNjk3QzIuMjk1MzkyLTYuOTgxODE4IDIuNTQ2NDUxLTYuODg2MTc3IDIuNjg5OTEzLTYuODg2MTc3QzMuMDEyNzAyLTYuODg2MTc3IDMuMjg3NjcxLTcuMTk3MDExIDMuMjg3NjcxLTcuNDYwMDI1WicvPgo8cGF0aCBpZD0nZzMtMTA2JyBkPSdNNC4xODQzMDktMy43ODk3ODhDNC4yMzIxMy0zLjk4MTA3MSA0LjIzMjEzLTQuMTQ4NDQzIDQuMjMyMTMtNC4xOTYyNjRDNC4yMzIxMy00Ljg4OTY2NCAzLjcxODA1Ny01LjI3MjIyOSAzLjE4MDA3NS01LjI3MjIyOUMxLjk3MjYwMy01LjI3MjIyOSAxLjMyNzAyNC0zLjUyNjc3NSAxLjMyNzAyNC0zLjQ0MzA4OEMxLjMyNzAyNC0zLjM4MzMxMyAxLjM3NDg0NC0zLjMzNTQ5MiAxLjQ0NjU3NS0zLjMzNTQ5MkMxLjU0MjIxNy0zLjMzNTQ5MiAxLjU1NDE3Mi0zLjM4MzMxMyAxLjYxMzk0OC0zLjUwMjg2NEMyLjA5MjE1NC00LjY2MjUxNiAyLjY4OTkxMy01LjAzMzEyNiAzLjE0NDIwOS01LjAzMzEyNkMzLjM5NTI2OC01LjAzMzEyNiAzLjUyNjc3NS00LjkwMTYxOSAzLjUyNjc3NS00LjQ4MzE4OEMzLjUyNjc3NS00LjE5NjI2NCAzLjQ5MDkwOS00LjA3NjcxMiAzLjQ0MzA4OC0zLjg2MTUxOUwyLjMwNzM0NyAuNjQ1NTc5QzIuMDgwMTk5IDEuNTMwMjYyIDEuNTE4MzA2IDIuMTk5NzUxIC44NjA3NzIgMi4xOTk3NTFDLjgxMjk1MSAyLjE5OTc1MSAuNTYxODkzIDIuMTk5NzUxIC4zMzQ3NDUgMi4wODAxOTlDLjYyMTY2OSAyLjAyMDQyMyAuODQ4ODE3IDEuNzkzMjc1IC44NDg4MTcgMS41MDYzNTFDLjg0ODgxNyAxLjMxNTA2OCAuNzA1MzU1IDEuMTIzNzg2IC40NDIzNDEgMS4xMjM3ODZDLjEzMTUwNyAxLjEyMzc4Ni0uMTU1NDE3IDEuMzg2OC0uMTU1NDE3IDEuNzQ1NDU1Qy0uMTU1NDE3IDIuMjM1NjE2IC4zNzA2MSAyLjQzODg1NCAuODYwNzcyIDIuNDM4ODU0QzEuNjg1Njc5IDIuNDM4ODU0IDIuNzczNTk5IDEuODI5MTQxIDMuMDcyNDc4IC42MzM2MjRMNC4xODQzMDktMy43ODk3ODhaTTQuNjc0NDcxLTcuNDYwMDI1QzQuNjc0NDcxLTcuNzU4OTA0IDQuNDIzNDEyLTcuODU0NTQ1IDQuMjc5OTUtNy44NTQ1NDVDMy45NTcxNjEtNy44NTQ1NDUgMy42ODIxOTItNy41NDM3MTEgMy42ODIxOTItNy4yODA2OTdDMy42ODIxOTItNy4xMDEzNyAzLjgyNTY1NC02Ljg4NjE3NyA0LjA4ODY2Ny02Ljg4NjE3N0M0LjM2MzYzNi02Ljg4NjE3NyA0LjY3NDQ3MS03LjE0OTE5MSA0LjY3NDQ3MS03LjQ2MDAyNVonLz4KPHBhdGggaWQ9J2czLTExMCcgZD0nTTIuNDYyNzY1LTMuNTAyODY0QzIuNDg2Njc1LTMuNTc0NTk1IDIuNzg1NTU0LTQuMTcyMzU0IDMuMjI3ODk1LTQuNTU0OTE5QzMuNTM4NzMtNC44NDE4NDMgMy45NDUyMDUtNS4wMzMxMjYgNC40MTE0NTctNS4wMzMxMjZDNC44ODk2NjQtNS4wMzMxMjYgNS4wNTcwMzYtNC42NzQ0NzEgNS4wNTcwMzYtNC4xOTYyNjRDNS4wNTcwMzYtMy41MTQ4MTkgNC41NjY4NzQtMi4xNTE5MyA0LjMyNzc3MS0xLjUwNjM1MUM0LjIyMDE3NC0xLjIxOTQyNyA0LjE2MDM5OS0xLjA2NDAxIDQuMTYwMzk5LS44NDg4MTdDNC4xNjAzOTktLjMxMDgzNCA0LjUzMTAwOSAuMTE5NTUyIDUuMTA0ODU3IC4xMTk1NTJDNi4yMTY2ODcgLjExOTU1MiA2LjYzNTExOC0xLjYzNzg1OCA2LjYzNTExOC0xLjcwOTU4OUM2LjYzNTExOC0xLjc2OTM2NSA2LjU4NzI5OC0xLjgxNzE4NiA2LjUxNTU2Ny0xLjgxNzE4NkM2LjQwNzk3LTEuODE3MTg2IDYuMzk2MDE1LTEuNzgxMzIgNi4zMzYyMzktMS41NzgwODJDNi4wNjEyNy0uNTk3NzU4IDUuNjA2OTc0LS4xMTk1NTIgNS4xNDA3MjItLjExOTU1MkM1LjAyMTE3MS0uMTE5NTUyIDQuODI5ODg4LS4xMzE1MDcgNC44Mjk4ODgtLjUxNDA3MkM0LjgyOTg4OC0uODEyOTUxIDQuOTYxMzk1LTEuMTcxNjA2IDUuMDMzMTI2LTEuMzM4OTc5QzUuMjcyMjI5LTEuOTk2NTEzIDUuNzc0MzQ2LTMuMzM1NDkyIDUuNzc0MzQ2LTQuMDE2OTM2QzUuNzc0MzQ2LTQuNzM0MjQ3IDUuMzU1OTE1LTUuMjcyMjI5IDQuNDQ3MzIzLTUuMjcyMjI5QzMuMzgzMzEzLTUuMjcyMjI5IDIuODIxNDItNC41MTkwNTQgMi42MDYyMjctNC4yMjAxNzRDMi41NzAzNjEtNC45MDE2MTkgMi4wODAxOTktNS4yNzIyMjkgMS41NTQxNzItNS4yNzIyMjlDMS4xNzE2MDYtNS4yNzIyMjkgLjkwODU5My01LjA0NTA4MSAuNzA1MzU1LTQuNjM4NjA1Qy40OTAxNjItNC4yMDgyMTkgLjMyMjc5LTMuNDkwOTA5IC4zMjI3OS0zLjQ0MzA4OFMuMzcwNjEtMy4zMzU0OTIgLjQ1NDI5Ni0zLjMzNTQ5MkMuNTQ5OTM4LTMuMzM1NDkyIC41NjE4OTMtMy4zNDc0NDcgLjYzMzYyNC0zLjYyMjQxNkMuODI0OTA3LTQuMzUxNjgxIDEuMDQwMS01LjAzMzEyNiAxLjUxODMwNi01LjAzMzEyNkMxLjc5MzI3NS01LjAzMzEyNiAxLjg4ODkxNy00Ljg0MTg0MyAxLjg4ODkxNy00LjQ4MzE4OEMxLjg4ODkxNy00LjIyMDE3NCAxLjc2OTM2NS0zLjc1MzkyMyAxLjY4NTY3OS0zLjM4MzMxM0wxLjM1MDkzNC0yLjA5MjE1NEMxLjMwMzExMy0xLjg2NTAwNiAxLjE3MTYwNi0xLjMyNzAyNCAxLjExMTgzMS0xLjExMTgzMUMxLjAyODE0NC0uODAwOTk2IC44OTY2MzgtLjIzOTEwMyAuODk2NjM4LS4xNzkzMjhDLjg5NjYzOC0uMDExOTU1IDEuMDI4MTQ0IC4xMTk1NTIgMS4yMDc0NzIgLjExOTU1MkMxLjM1MDkzNCAuMTE5NTUyIDEuNTE4MzA2IC4wNDc4MjEgMS42MTM5NDgtLjEzMTUwN0MxLjYzNzg1OC0uMTkxMjgzIDEuNzQ1NDU1LS42MDk3MTQgMS44MDUyMy0uODQ4ODE3TDIuMDY4MjQ0LTEuOTI0NzgyTDIuNDYyNzY1LTMuNTAyODY0WicvPgo8cGF0aCBpZD0nZzMtMTE0JyBkPSdNNC42NTA1Ni00Ljg4OTY2NEM0LjI3OTk1LTQuODE3OTMzIDQuMDg4NjY3LTQuNTU0OTE5IDQuMDg4NjY3LTQuMjkxOTA1QzQuMDg4NjY3LTQuMDA0OTgxIDQuMzE1ODE2LTMuOTA5MzQgNC40ODMxODgtMy45MDkzNEM0LjgxNzkzMy0zLjkwOTM0IDUuMDkyOTAyLTQuMTk2MjY0IDUuMDkyOTAyLTQuNTU0OTE5QzUuMDkyOTAyLTQuOTM3NDg0IDQuNzIyMjkxLTUuMjcyMjI5IDQuMTI0NTMzLTUuMjcyMjI5QzMuNjQ2MzI2LTUuMjcyMjI5IDMuMDk2Mzg5LTUuMDU3MDM2IDIuNTk0MjcxLTQuMzI3NzcxQzIuNTEwNTg1LTQuOTYxMzk1IDIuMDMyMzc5LTUuMjcyMjI5IDEuNTU0MTcyLTUuMjcyMjI5QzEuMDg3OTItNS4yNzIyMjkgLjg0ODgxNy00LjkxMzU3NCAuNzA1MzU1LTQuNjUwNTZDLjUwMjExNy00LjIyMDE3NCAuMzIyNzktMy41MDI4NjQgLjMyMjc5LTMuNDQzMDg4Qy4zMjI3OS0zLjM5NTI2OCAuMzcwNjEtMy4zMzU0OTIgLjQ1NDI5Ni0zLjMzNTQ5MkMuNTQ5OTM4LTMuMzM1NDkyIC41NjE4OTMtMy4zNDc0NDcgLjYzMzYyNC0zLjYyMjQxNkMuODEyOTUxLTQuMzM5NzI2IDEuMDQwMS01LjAzMzEyNiAxLjUxODMwNi01LjAzMzEyNkMxLjgwNTIzLTUuMDMzMTI2IDEuODg4OTE3LTQuODI5ODg4IDEuODg4OTE3LTQuNDgzMTg4QzEuODg4OTE3LTQuMjIwMTc0IDEuNzY5MzY1LTMuNzUzOTIzIDEuNjg1Njc5LTMuMzgzMzEzTDEuMzUwOTM0LTIuMDkyMTU0QzEuMzAzMTEzLTEuODY1MDA2IDEuMTcxNjA2LTEuMzI3MDI0IDEuMTExODMxLTEuMTExODMxQzEuMDI4MTQ0LS44MDA5OTYgLjg5NjYzOC0uMjM5MTAzIC44OTY2MzgtLjE3OTMyOEMuODk2NjM4LS4wMTE5NTUgMS4wMjgxNDQgLjExOTU1MiAxLjIwNzQ3MiAuMTE5NTUyQzEuMzM4OTc5IC4xMTk1NTIgMS41NjYxMjcgLjAzNTg2NiAxLjYzNzg1OC0uMjAzMjM4QzEuNjczNzI0LS4yOTg4NzkgMi4xMTYwNjUtMi4xMDQxMSAyLjE4Nzc5Ni0yLjM3OTA3OEMyLjI0NzU3Mi0yLjY0MjA5MiAyLjMxOTMwMy0yLjg5MzE1MSAyLjM3OTA3OC0zLjE1NjE2NEMyLjQyNjg5OS0zLjMyMzUzNyAyLjQ3NDcyLTMuNTE0ODE5IDIuNTEwNTg1LTMuNjcwMjM3QzIuNTQ2NDUxLTMuNzc3ODMzIDIuODY5MjQtNC4zNjM2MzYgMy4xNjgxMi00LjYyNjY1QzMuMzExNTgyLTQuNzU4MTU3IDMuNjIyNDE2LTUuMDMzMTI2IDQuMTEyNTc4LTUuMDMzMTI2QzQuMzAzODYxLTUuMDMzMTI2IDQuNDk1MTQzLTQuOTk3MjYgNC42NTA1Ni00Ljg4OTY2NFonLz4KPHBhdGggaWQ9J2cwLTgnIGQ9J00zLjA3MjQ3OCA0Ljc3MDExMkMzLjA3MjQ3OCA1LjYwNjk3NCAyLjY1NDA0NyA2LjA2MTI3IDEuNDQ2NTc1IDYuNTM5NDc3QzEuMzg2OCA2LjU2MzM4NyAxLjM1MDkzNCA2LjYxMTIwOCAxLjM1MDkzNCA2LjY4MjkzOUMxLjM1MDkzNCA2Ljc3ODU4IDEuMzc0ODQ0IDYuODE0NDQ2IDEuNDcwNDg2IDYuODUwMzExQzMuMDcyNDc4IDcuNDcxOTggMy4wNzI0NzggOC4xMTc1NTkgMy4wNzI0NzggOC43ODcwNDlWMTIuMDg2Njc1QzMuMDg0NDMzIDEyLjQwOTQ2NSAzLjI2Mzc2MSAxMi44NTE4MDYgMy43ODk3ODggMTMuMjEwNDYxQzQuMzc1NTkyIDEzLjYwNDk4MSA1LjM0Mzk2IDEzLjg1NjA0IDUuNDUxNTU3IDEzLjg1NjA0QzUuNTcxMTA4IDEzLjg1NjA0IDUuNjA2OTc0IDEzLjgwODIxOSA1LjYwNjk3NCAxMy43MDA2MjNTNS41ODMwNjQgMTMuNTgxMDcxIDUuNDAzNzM2IDEzLjUyMTI5NUM1LjA1NzAzNiAxMy4zODk3ODggNC4xMjQ1MzMgMTMuMDE5MTc4IDMuOTMzMjUgMTIuMjg5OTEzQzMuODk3Mzg1IDEyLjE0NjQ1MSAzLjg5NzM4NSAxMi4xMjI1NCAzLjg5NzM4NSAxMS42ODAxOTlWOC43NTExODNDMy44OTczODUgOC4xMjk1MTQgMy44OTczODUgNy4yNTY3ODcgMS45NDg2OTIgNi42OTQ4OTRDMy44OTczODUgNi4wOTcxMzYgMy44OTczODUgNS4yODQxODQgMy44OTczODUgNC42MTQ2OTVWMS42ODU2NzlDMy44OTczODUgMS4wMjgxNDQgMy44OTczODUgLjQwNjQ3NiA1LjUyMzI4OC0uMTkxMjgzQzUuNjA2OTc0LS4yMTUxOTMgNS42MDY5NzQtLjI5ODg3OSA1LjYwNjk3NC0uMzIyNzlDNS42MDY5NzQtLjQzMDM4NiA1LjU3MTEwOC0uNDc4MjA3IDUuNDUxNTU3LS40NzgyMDdDNS4zNjc4Ny0uNDc4MjA3IDMuNjgyMTkyLS4wOTU2NDEgMy4yNjM3NjEgLjY5MzRDMy4wNzI0NzggMS4wNTIwNTUgMy4wNzI0NzggMS4xNTk2NTEgMy4wNzI0NzggMS42NzM3MjRWNC43NzAxMTJaJy8+CjxwYXRoIGlkPSdnMC05JyBkPSdNMy44OTczODUgOC42MDc3MjFDMy44OTczODUgOC4yMTMyIDMuODk3Mzg1IDcuNDcxOTggNS40Mjc2NDYgNi44NjIyNjdDNS41ODMwNjQgNi44MDI0OTEgNS42MDY5NzQgNi44MDI0OTEgNS42MDY5NzQgNi42ODI5MzlDNS42MDY5NzQgNi42NTkwMjkgNS42MDY5NzQgNi41NzUzNDIgNS41MjMyODggNi41NTE0MzJDMy44OTczODUgNS45MTc4MDggMy44OTczODUgNS4yNzIyMjkgMy44OTczODUgNC41OTA3ODVWMS4yOTExNThDMy44NzM0NzQgLjY0NTU3OSAzLjM0NzQ0NyAuMjc0OTY5IDMuMTU2MTY0IC4xNDM0NjJDMi42NDIwOTItLjIwMzIzOCAxLjYzNzg1OC0uNDc4MjA3IDEuNTA2MzUxLS40NzgyMDdDMS4zODY4LS40NzgyMDcgMS4zNTA5MzQtLjQxODQzMSAxLjM1MDkzNC0uMzIyNzlDMS4zNTA5MzQtLjIxNTE5MyAxLjQxMDcxLS4xOTEyODMgMS40OTQzOTYtLjE2NzM3MkMzLjA3MjQ3OCAuNDMwMzg2IDMuMDcyNDc4IDEuMDI4MTQ0IDMuMDcyNDc4IDEuNjk3NjM0VjQuNjI2NjVDMy4wNzI0NzggNS4yODQxODQgMy4wNzI0NzggNi4wOTcxMzYgNS4wMDkyMTUgNi42ODI5MzlDMy4wNzI0NzggNy4zMjg1MTggMy4wNzI0NzggOC4wMjE5MTggMy4wNzI0NzggOC43NjMxMzhWMTEuNjkyMTU0QzMuMDcyNDc4IDEyLjMxMzgyMyAzLjA3MjQ3OCAxMi45NDc0NDcgMS41NDIyMTcgMTMuNTIxMjk1QzEuMzk4NzU1IDEzLjU4MTA3MSAxLjM1MDkzNCAxMy41OTMwMjYgMS4zNTA5MzQgMTMuNzAwNjIzQzEuMzUwOTM0IDEzLjc5NjI2NCAxLjM4NjggMTMuODU2MDQgMS41MDYzNTEgMTMuODU2MDRDMS41MTgzMDYgMTMuODU2MDQgMy4wOTYzODkgMTMuNTU3MTYxIDMuNjU4MjgxIDEyLjc2ODEyQzMuODk3Mzg1IDEyLjQyMTQyIDMuODk3Mzg1IDEyLjE1ODQwNiAzLjg5NzM4NSAxMS43MDQxMVY4LjYwNzcyMVonLz4KPHBhdGggaWQ9J2cwLTk4JyBkPSdNMy4zMTE1ODItOC4xODkyOUw2LjU2MzM4Ny02LjcxODgwNEw2LjcwNjg0OS02Ljk4MTgxOEwzLjMyMzUzNy04Ljg5NDY0NUwtLjA1OTc3Ni02Ljk4MTgxOEwuMDcxNzMxLTYuNzE4ODA0TDMuMzExNTgyLTguMTg5MjlaJy8+CjwvZGVmcz4KPGcgaWQ9J3BhZ2UxJz4KPHVzZSB4PSc0MS45OTk3ODgnIHk9Jy0xMi4zNTE3NTInIHhsaW5rOmhyZWY9JyNnMC05OCcvPgo8dXNlIHg9JzQyLjI3NjU2NycgeT0nLTkuMTk2OTI2JyB4bGluazpocmVmPScjZzMtMTA0Jy8+Cjx1c2UgeD0nNDkuMDE1MTIyJyB5PSctNy40MDM2NjMnIHhsaW5rOmhyZWY9JyNnMi0xMDUnLz4KPHVzZSB4PSc1NS43MTcyMjMnIHk9Jy05LjE5NjkyNicgeGxpbms6aHJlZj0nI2c1LTYxJy8+Cjx1c2UgeD0nODAuMTM3OTI5JyB5PSctMTcuMjg0Njg1JyB4bGluazpocmVmPScjZzUtNDknLz4KPHJlY3QgeD0nNjkuMzM4MjE4JyB5PSctMTIuNDI0ODEyJyBoZWlnaHQ9Jy40NzgxODcnIHdpZHRoPScyNy40NTI0MTInLz4KPHVzZSB4PSc2OS4zMzgyMTgnIHk9Jy0uOTk2MjY0JyB4bGluazpocmVmPScjZzMtMTEwJy8+Cjx1c2UgeD0nNzguOTgyNDg3JyB5PSctLjk5NjI2NCcgeGxpbms6aHJlZj0nI2cxLTAnLz4KPHVzZSB4PSc5MC45Mzc2NDcnIHk9Jy0uOTk2MjY0JyB4bGluazpocmVmPScjZzUtNDknLz4KPHVzZSB4PSc5Ny45ODYxNDQnIHk9Jy05LjE5NjkyNicgeGxpbms6aHJlZj0nI2czLTY3Jy8+Cjx1c2UgeD0nMTA3LjIxOTc1NicgeT0nLTkuMTk2OTI2JyB4bGluazpocmVmPScjZzMtOTcnLz4KPHVzZSB4PScxMTMuMzY0NycgeT0nLTkuMTk2OTI2JyB4bGluazpocmVmPScjZzMtMTE0Jy8+Cjx1c2UgeD0nMTE4Ljk2NTE3NCcgeT0nLTkuMTk2OTI2JyB4bGluazpocmVmPScjZzMtMTAwJy8+Cjx1c2UgeD0nMTI3LjA0MDM2NCcgeT0nLTE4Ljg4MDY5JyB4bGluazpocmVmPScjZzAtOCcvPgo8dXNlIHg9JzEzNC4wMTQyNDMnIHk9Jy05LjE5NjkyNicgeGxpbms6aHJlZj0nI2czLTEwNicvPgo8dXNlIHg9JzE0Mi44NTA1NjgnIHk9Jy05LjE5NjkyNicgeGxpbms6aHJlZj0nI2cxLTUwJy8+Cjx1c2UgeD0nMTU0LjE0MTUzNicgeT0nLTkuMTk2OTI2JyB4bGluazpocmVmPScjZzUtOTEnLz4KPHVzZSB4PScxNTcuMzkzMTk3JyB5PSctOS4xOTY5MjYnIHhsaW5rOmhyZWY9JyNnNS00OScvPgo8dXNlIHg9JzE2My4yNDYxODcnIHk9Jy05LjE5NjkyNicgeGxpbms6aHJlZj0nI2czLTU5Jy8+Cjx1c2UgeD0nMTY4LjQ5MDM0NicgeT0nLTkuMTk2OTI2JyB4bGluazpocmVmPScjZzMtMTEwJy8+Cjx1c2UgeD0nMTc1LjQ3Nzk1MicgeT0nLTkuMTk2OTI2JyB4bGluazpocmVmPScjZzUtOTMnLz4KPHVzZSB4PScxNzguNzI5NjEzJyB5PSctOS4xOTY5MjYnIHhsaW5rOmhyZWY9JyNnMy01OScvPgo8dXNlIHg9JzE4My45NzM3NzInIHk9Jy05LjE5NjkyNicgeGxpbms6aHJlZj0nI2czLTEwNicvPgo8dXNlIHg9JzE5Mi44MTAwOTcnIHk9Jy05LjE5NjkyNicgeGxpbms6aHJlZj0nI2cxLTU0Jy8+Cjx1c2UgeD0nMTkyLjgxMDA5NycgeT0nLTkuMTk2OTI2JyB4bGluazpocmVmPScjZzUtNjEnLz4KPHVzZSB4PScyMDUuMjM1NTc3JyB5PSctOS4xOTY5MjYnIHhsaW5rOmhyZWY9JyNnMy0xMDUnLz4KPHVzZSB4PScyMDkuMjI5MDEnIHk9Jy05LjE5NjkyNicgeGxpbms6aHJlZj0nI2czLTU5Jy8+Cjx1c2UgeD0nMjE2LjQ2NTY2NicgeT0nLTkuMTk2OTI2JyB4bGluazpocmVmPScjZzEtMTA2Jy8+Cjx1c2UgeD0nMjIxLjc3OTA1NCcgeT0nLTkuMTk2OTI2JyB4bGluazpocmVmPScjZzMtODgnLz4KPHVzZSB4PScyMzIuNDM0MTYyJyB5PSctMTQuODY0NTQ2JyB4bGluazpocmVmPScjZzItMTA2Jy8+Cjx1c2UgeD0nMjMxLjQ5NDI4MScgeT0nLTYuMjY1NzQ5JyB4bGluazpocmVmPScjZzQtNDknLz4KPHVzZSB4PScyNDAuMTM3MTQ4JyB5PSctOS4xOTY5MjYnIHhsaW5rOmhyZWY9JyNnMS0yMCcvPgo8dXNlIHg9JzI1Mi43NTY0NzUnIHk9Jy05LjE5NjkyNicgeGxpbms6aHJlZj0nI2czLTg4Jy8+Cjx1c2UgeD0nMjYzLjQxMTU4MicgeT0nLTE0LjEzMzExMicgeGxpbms6aHJlZj0nI2cyLTEwNScvPgo8dXNlIHg9JzI2Mi40NzE3MDInIHk9Jy02LjI0MTQxMScgeGxpbms6aHJlZj0nI2c0LTQ5Jy8+Cjx1c2UgeD0nMjcxLjEwNjAxJyB5PSctOS4xOTY5MjYnIHhsaW5rOmhyZWY9JyNnNS05NycvPgo8dXNlIHg9JzI3Ni45NTknIHk9Jy05LjE5NjkyNicgeGxpbms6aHJlZj0nI2c1LTExMCcvPgo8dXNlIHg9JzI4My40NjIzMjMnIHk9Jy05LjE5NjkyNicgeGxpbms6aHJlZj0nI2c1LTEwMCcvPgo8dXNlIHg9JzI5My44Njc2MzknIHk9Jy05LjE5NjkyNicgeGxpbms6aHJlZj0nI2czLTg4Jy8+Cjx1c2UgeD0nMzA0LjUyMjc0NycgeT0nLTE0Ljg2NDU0NicgeGxpbms6aHJlZj0nI2cyLTEwNicvPgo8dXNlIHg9JzMwMy41ODI4NjYnIHk9Jy02LjI2NTc0OScgeGxpbms6aHJlZj0nI2c0LTUwJy8+Cjx1c2UgeD0nMzEyLjIyNTczMycgeT0nLTkuMTk2OTI2JyB4bGluazpocmVmPScjZzEtMjAnLz4KPHVzZSB4PSczMjQuODQ1MDYnIHk9Jy05LjE5NjkyNicgeGxpbms6aHJlZj0nI2czLTg4Jy8+Cjx1c2UgeD0nMzM1LjUwMDE2OCcgeT0nLTE0LjEzMzExMicgeGxpbms6aHJlZj0nI2cyLTEwNScvPgo8dXNlIHg9JzMzNC41NjAyODcnIHk9Jy02LjI0MTQxMScgeGxpbms6aHJlZj0nI2c0LTUwJy8+Cjx1c2UgeD0nMzM5LjI5MjYwMicgeT0nLTE4Ljg4MDY5JyB4bGluazpocmVmPScjZzAtOScvPgo8L2c+Cjwvc3ZnPgo8IS0tIERFUFRIPTAgLS0+)
From the sample , we build the ordered sample
 .
.
Let  be the order statistics of
  .
Then we know that the cumulative distribution function of
.
Then we know that the cumulative distribution function of  is the composition between the cumulative
distribution function of the
is the composition between the cumulative
distribution function of the  distribution and the distribution of :

Let  be the statistic defined by:

Thus we have:
(1)
For a given copula , equation (1) is evaluated by Monte Carlo
sampling: we generate  samples of size
 from
from  , in order to get
realizations of the statistics
, in order to get
realizations of the statistics
 that are used to calculate
as the empirical mean of .
that are used to calculate
as the empirical mean of .
The Kendall Plot draws the points  .
If the points are on the first diagonal, the copula is
validated.
In particular, we can use the Kendall plot to test the independence between
.
If the points are on the first diagonal, the copula is
validated.
In particular, we can use the Kendall plot to test the independence between  and
and  by using the independent copula to calculate the values
  .
.
To test whether two samples share the same copula, the Kendall
Plot test draws the points
 respectively
associated to the first and second sample. Note that the two samples
must have the same size.
respectively
associated to the first and second sample. Note that the two samples
must have the same size.
In the first example, the Kendall Plot test validates the use of the Frank copula for the given sample.
(Source code, png)
In the second example, the Kendall Plot test invalidates the use of the Frank copula for the given sample.
(Source code, png)

Remark: In the case where you want to test a sample with respect to a specific copula, if the size of the sample is greater than 500, we recommend to use the second form of the Kendall plot test: generate a sample of the proper size from your copula and then test both samples. Testing this way is more efficient.