QQ-plot
The Quantile - Quantile - Plot (QQ Plot) enables to validate whether two given samples of data are drawn from the same continuous distribution of dimension 1.
We denote by  and
and  two given samples of dimension 1.
A QQ-Plot is based on the comparison of some empirical quantiles. Let  be the quantile of order
 of the distribution
  , with
  . It is defined by:

The empirical quantile of order built on the sample is defined by:
![\begin{aligned}
\widehat{q}_{X}(\alpha) = x_{([\sampleSize \alpha]+1)}
\end{aligned}](data:image/svg+xml;base64,PD94bWwgdmVyc2lvbj0nMS4wJyBlbmNvZGluZz0nVVRGLTgnPz4KPCEtLSBUaGlzIGZpbGUgd2FzIGdlbmVyYXRlZCBieSBkdmlzdmdtIDMuNC4yIC0tPgo8c3ZnIHZlcnNpb249JzEuMScgeG1sbnM9J2h0dHA6Ly93d3cudzMub3JnLzIwMDAvc3ZnJyB4bWxuczp4bGluaz0naHR0cDovL3d3dy53My5vcmcvMTk5OS94bGluaycgd2lkdGg9Jzg0Ljk4OTAxOXB0JyBoZWlnaHQ9JzEyLjgxODYxNHB0JyB2aWV3Qm94PScxNTEuNTI3OTAxIC0xMy40NDk2NzEgODQuOTg5MDE5IDEyLjgxODYxNCc+CjxkZWZzPgo8cGF0aCBpZD0nZzQtNDAnIGQ9J00zLjg4NTQzIDIuOTA1MTA2QzMuODg1NDMgMi44NjkyNCAzLjg4NTQzIDIuODQ1MzMgMy42ODIxOTIgMi42NDIwOTJDMi40ODY2NzUgMS40MzQ2MiAxLjgxNzE4Ni0uNTM3OTgzIDEuODE3MTg2LTIuOTc2ODM3QzEuODE3MTg2LTUuMjk2MTM5IDIuMzc5MDc4LTcuMjkyNjUzIDMuNzY1ODc4LTguNzAzMzYyQzMuODg1NDMtOC44MTA5NTkgMy44ODU0My04LjgzNDg2OSAzLjg4NTQzLTguODcwNzM1QzMuODg1NDMtOC45NDI0NjYgMy44MjU2NTQtOC45NjYzNzYgMy43Nzc4MzMtOC45NjYzNzZDMy42MjI0MTYtOC45NjYzNzYgMi42NDIwOTItOC4xMDU2MDQgMi4wNTYyODktNi45MzM5OThDMS40NDY1NzUtNS43MjY1MjYgMS4xNzE2MDYtNC40NDczMjMgMS4xNzE2MDYtMi45NzY4MzdDMS4xNzE2MDYtMS45MTI4MjcgMS4zMzg5NzktLjQ5MDE2MiAxLjk2MDY0OCAuNzg5MDQxQzIuNjY2MDAyIDIuMjIzNjYxIDMuNjQ2MzI2IDMuMDAwNzQ3IDMuNzc3ODMzIDMuMDAwNzQ3QzMuODI1NjU0IDMuMDAwNzQ3IDMuODg1NDMgMi45NzY4MzcgMy44ODU0MyAyLjkwNTEwNlonLz4KPHBhdGggaWQ9J2c0LTQxJyBkPSdNMy4zNzEzNTctMi45NzY4MzdDMy4zNzEzNTctMy44ODU0MyAzLjI1MTgwNi01LjM2Nzg3IDIuNTgyMzE2LTYuNzU0NjdDMS44NzY5NjEtOC4xODkyOSAuODk2NjM4LTguOTY2Mzc2IC43NjUxMzEtOC45NjYzNzZDLjcxNzMxLTguOTY2Mzc2IC42NTc1MzQtOC45NDI0NjYgLjY1NzUzNC04Ljg3MDczNUMuNjU3NTM0LTguODM0ODY5IC42NTc1MzQtOC44MTA5NTkgLjg2MDc3Mi04LjYwNzcyMUMyLjA1NjI4OS03LjQwMDI0OSAyLjcyNTc3OC01LjQyNzY0NiAyLjcyNTc3OC0yLjk4ODc5MkMyLjcyNTc3OC0uNjY5NDg5IDIuMTYzODg1IDEuMzI3MDI0IC43NzcwODYgMi43Mzc3MzNDLjY1NzUzNCAyLjg0NTMzIC42NTc1MzQgMi44NjkyNCAuNjU3NTM0IDIuOTA1MTA2Qy42NTc1MzQgMi45NzY4MzcgLjcxNzMxIDMuMDAwNzQ3IC43NjUxMzEgMy4wMDA3NDdDLjkyMDU0OCAzLjAwMDc0NyAxLjkwMDg3MiAyLjEzOTk3NSAyLjQ4NjY3NSAuOTY4MzY5QzMuMDk2Mzg5LS4yNTEwNTkgMy4zNzEzNTctMS41NDIyMTcgMy4zNzEzNTctMi45NzY4MzdaJy8+CjxwYXRoIGlkPSdnNC02MScgZD0nTTguMDY5NzM4LTMuODczNDc0QzguMjM3MTExLTMuODczNDc0IDguNDUyMzA0LTMuODczNDc0IDguNDUyMzA0LTQuMDg4NjY3QzguNDUyMzA0LTQuMzE1ODE2IDguMjQ5MDY2LTQuMzE1ODE2IDguMDY5NzM4LTQuMzE1ODE2SDEuMDI4MTQ0Qy44NjA3NzItNC4zMTU4MTYgLjY0NTU3OS00LjMxNTgxNiAuNjQ1NTc5LTQuMTAwNjIzQy42NDU1NzktMy44NzM0NzQgLjg0ODgxNy0zLjg3MzQ3NCAxLjAyODE0NC0zLjg3MzQ3NEg4LjA2OTczOFpNOC4wNjk3MzgtMS42NDk4MTNDOC4yMzcxMTEtMS42NDk4MTMgOC40NTIzMDQtMS42NDk4MTMgOC40NTIzMDQtMS44NjUwMDZDOC40NTIzMDQtMi4wOTIxNTQgOC4yNDkwNjYtMi4wOTIxNTQgOC4wNjk3MzgtMi4wOTIxNTRIMS4wMjgxNDRDLjg2MDc3Mi0yLjA5MjE1NCAuNjQ1NTc5LTIuMDkyMTU0IC42NDU1NzktMS44NzY5NjFDLjY0NTU3OS0xLjY0OTgxMyAuODQ4ODE3LTEuNjQ5ODEzIDEuMDI4MTQ0LTEuNjQ5ODEzSDguMDY5NzM4WicvPgo8cGF0aCBpZD0nZzEtMTEnIGQ9J000LjA2NDc1Ny0xLjExNTgxNkM0LjgwNTk3OC0xLjkyODc2NyA1LjA2ODk5MS0yLjk2NDg4MiA1LjA2ODk5MS0zLjAyODY0M0M1LjA2ODk5MS0zLjEwMDM3NCA1LjAyMTE3MS0zLjEzMjI1NCA0Ljk0OTQ0LTMuMTMyMjU0QzQuODQ1ODI4LTMuMTMyMjU0IDQuODM3ODU4LTMuMTAwMzc0IDQuNzkwMDM3LTIuOTMzMDAxQzQuNTY2ODc0LTIuMTIwMDUgNC4wODg2NjctMS40OTgzODEgNC4wNjQ3NTctMS40OTgzODFDNC4wNDg4MTctMS40OTgzODEgNC4wNDg4MTctMS42OTc2MzQgNC4wNDg4MTctMS44MjUxNTZDNC4wMzI4NzctMy4yMjc4OTUgMy4xMjQyODQtMy41MTQ4MTkgMi41ODIzMTYtMy41MTQ4MTlDMS40NTg1MzEtMy41MTQ4MTkgLjM1MDY4NS0yLjQyMjkxNCAuMzUwNjg1LTEuMjk5MTI4Qy4zNTA2ODUtLjUxMDA4NyAuOTAwNjIzIC4wNzk3MDEgMS43NDU0NTUgLjA3OTcwMUMyLjMwMzM2MiAuMDc5NzAxIDIuODkzMTUxLS4xMTk1NTIgMy41MjI3OS0uNTg5Nzg4QzMuNjk4MTMyIC4wMzk4NTEgNC4xNjAzOTkgLjA3OTcwMSA0LjMwMzg2MSAuMDc5NzAxQzQuNzU4MTU3IC4wNzk3MDEgNS4wMjExNzEtLjMyNjc3NSA1LjAyMTE3MS0uNDc4MjA3QzUuMDIxMTcxLS41NzM4NDggNC45MjU1MjktLjU3Mzg0OCA0LjkwMTYxOS0uNTczODQ4QzQuODEzOTQ4LS41NzM4NDggNC43OTgwMDctLjU0OTkzOCA0Ljc3NDA5Ny0uNDk0MTQ3QzQuNjQ2NTc1LS4xNTk0MDIgNC4zNzU1OTItLjE0MzQ2MiA0LjMzNTc0MS0uMTQzNDYyQzQuMjI0MTU5LS4xNDM0NjIgNC4wOTY2MzgtLjE0MzQ2MiA0LjA2NDc1Ny0xLjExNTgxNlpNMy40NjY5OTktLjg1MjgwMkMyLjkwMTEyMS0uMzQyNzE1IDIuMjMxNjMxLS4xNDM0NjIgMS43NjkzNjUtLjE0MzQ2MkMxLjM1NDkxOS0uMTQzNDYyIC45OTYyNjQtLjM4MjU2NSAuOTk2MjY0LTEuMDIwMTc0Qy45OTYyNjQtMS4yOTkxMjggMS4xMjM3ODYtMi4xMjAwNSAxLjQ5ODM4MS0yLjY1NDA0N0MxLjgxNzE4Ni0zLjEwMDM3NCAyLjI0NzU3Mi0zLjI5MTY1NiAyLjU3NDM0Ni0zLjI5MTY1NkMzLjAxMjcwMi0zLjI5MTY1NiAzLjI1OTc3Ni0yLjk4MDgyMiAzLjM2MzM4Ny0yLjQ5NDY0NUMzLjQ4MjkzOS0xLjk1MjY3NyAzLjQxOTE3OC0xLjMxNTA2OCAzLjQ2Njk5OS0uODUyODAyWicvPgo8cGF0aCBpZD0nZzEtODgnIGQ9J000LjE2MDM5OS0zLjA0NDU4M0M0LjU0Mjk2NC0zLjQzNTExOCA1LjY3NDcyLTQuNTk4NzU1IDUuODY2MDAyLTQuNzUwMTg3QzYuMjAwNzQ3LTUuMDA1MjMgNi40LTUuMTQ4NjkyIDYuOTczODQ4LTUuMTgwNTczQzcuMDIxNjY5LTUuMTg4NTQzIDcuMDg1NDMtNS4yMjgzOTQgNy4wODU0My01LjMzMjAwNUM3LjA4NTQzLTUuNDAzNzM2IDcuMDEzNjk5LTUuNDQzNTg3IDYuOTczODQ4LTUuNDQzNTg3QzYuODk0MTQ3LTUuNDQzNTg3IDYuODQ2MzI2LTUuNDE5Njc2IDYuMjI0NjU4LTUuNDE5Njc2QzUuNjI2ODk5LTUuNDE5Njc2IDUuNDExNzA2LTUuNDQzNTg3IDUuMzcxODU2LTUuNDQzNTg3QzUuMzM5OTc1LTUuNDQzNTg3IDUuMjEyNDUzLTUuNDQzNTg3IDUuMjEyNDUzLTUuMjkyMTU0QzUuMjEyNDUzLTUuMjg0MTg0IDUuMjEyNDUzLTUuMTg4NTQzIDUuMzMyMDA1LTUuMTgwNTczQzUuMzg3Nzk2LTUuMTcyNjAzIDUuNjAyOTg5LTUuMTU2NjYzIDUuNjAyOTg5LTQuOTczMzVDNS42MDI5ODktNC45MTc1NTkgNS41NzExMDgtNC44Mjk4ODggNS41MDczNDctNC43NjYxMjdMNS40ODM0MzctNC43MjYyNzZDNS40NTk1MjctNC43MDIzNjYgNS40NTk1MjctNC42ODY0MjYgNS4zNzk4MjYtNC42MTQ2OTVMNC4wNDg4MTctMy4yNjc3NDZMMy4yMzU4NjYtNC45NTc0MUMzLjM0NzQ0Ny01LjE0ODY5MiAzLjU4NjU1LTUuMTcyNjAzIDMuNjgyMTkyLTUuMTgwNTczQzMuNzIyMDQyLTUuMTgwNTczIDMuODMzNjI0LTUuMTg4NTQzIDMuODMzNjI0LTUuMzI0MDM1QzMuODMzNjI0LTUuMzk1NzY2IDMuNzc3ODMzLTUuNDQzNTg3IDMuNzA2MTAyLTUuNDQzNTg3QzMuNjI2NDAxLTUuNDQzNTg3IDMuMzIzNTM3LTUuNDI3NjQ2IDMuMjQzODM2LTUuNDI3NjQ2QzMuMTk2MDE1LTUuNDE5Njc2IDIuOTAxMTIxLTUuNDE5Njc2IDIuNzMzNzQ4LTUuNDE5Njc2QzEuOTkyNTI4LTUuNDE5Njc2IDEuODk2ODg3LTUuNDQzNTg3IDEuODI1MTU2LTUuNDQzNTg3QzEuNzkzMjc1LTUuNDQzNTg3IDEuNjY1NzUzLTUuNDQzNTg3IDEuNjY1NzUzLTUuMjkyMTU0QzEuNjY1NzUzLTUuMTgwNTczIDEuNzY5MzY1LTUuMTgwNTczIDEuODk2ODg3LTUuMTgwNTczQzIuMjk1MzkyLTUuMTgwNTczIDIuMzY3MTIzLTUuMTAwODcyIDIuNDM4ODU0LTQuOTQ5NDRMMy40OTg4NzktMi43MTc4MDhMMS44NjUwMDYtMS4wNTIwNTVDMS4zODY4LS41NzM4NDggMS4wMTIyMDQtLjI5NDg5NCAuNDQ2MzI2LS4yNjMwMTRDLjM1MDY4NS0uMjU1MDQ0IC4yNTUwNDQtLjI1NTA0NCAuMjU1MDQ0LS4xMTE1ODJDLjI1NTA0NC0uMDYzNzYxIC4yOTQ4OTQgMCAuMzc0NTk1IDBDLjQzMDM4NiAwIC41MTgwNTctLjAyMzkxIDEuMTIzNzg2LS4wMjM5MUMxLjY5NzYzNC0uMDIzOTEgMS45NDQ3MDcgMCAxLjk3NjU4OCAwQzIuMDE2NDM4IDAgMi4xMzU5OSAwIDIuMTM1OTktLjE1MTQzMkMyLjEzNTk5LS4xNjczNzIgMi4xMjgwMi0uMjU1MDQ0IDIuMDA4NDY4LS4yNjMwMTRDMS44NTcwMzYtLjI3MDk4NCAxLjc0NTQ1NS0uMzI2Nzc1IDEuNzQ1NDU1LS40NzAyMzdDMS43NDU0NTUtLjU5Nzc1OCAxLjg0MTA5Ni0uNzAxMzcgMS45NjA2NDgtLjgyMDkyMkMyLjA5NjEzOS0uOTcyMzU0IDIuNTEwNTg1LTEuMzg2OCAyLjc5NzUwOS0xLjY2NTc1M0MyLjk4MDgyMi0xLjg0OTA2NiAzLjQyNzE0OC0yLjMxMTMzMyAzLjYxMDQ2MS0yLjQ4NjY3NUw0LjUyNzAyNC0uNTgxODE4QzQuNTY2ODc0LS41MDIxMTcgNC41NjY4NzQtLjQ5NDE0NyA0LjU2Njg3NC0uNDg2MTc3QzQuNTY2ODc0LS40MTQ0NDYgNC4zOTk1MDItLjI3ODk1NCA0LjEzNjQ4OC0uMjYzMDE0QzQuMDgwNjk3LS4yNjMwMTQgMy45NzcwODYtLjI1NTA0NCAzLjk3NzA4Ni0uMTExNTgyQzMuOTc3MDg2LS4xMDM2MTEgMy45ODUwNTYgMCA0LjExMjU3OCAwQzQuMTkyMjc5IDAgNC40ODcxNzMtLjAxNTk0IDQuNTY2ODc0LS4wMjM5MUg1LjA3Njk2MUM1LjgxMDIxMi0uMDIzOTEgNS45MjE3OTMgMCA1Ljk5MzUyNCAwQzYuMDI1NDA1IDAgNi4xNDQ5NTYgMCA2LjE0NDk1Ni0uMTUxNDMyQzYuMTQ0OTU2LS4yNjMwMTQgNi4wNDEzNDUtLjI2MzAxNCA1LjkyMTc5My0uMjYzMDE0QzUuNDkxNDA3LS4yNjMwMTQgNS40NDM1ODctLjM1ODY1NSA1LjM4Nzc5Ni0uNDc4MjA3TDQuMTYwMzk5LTMuMDQ0NTgzWicvPgo8cGF0aCBpZD0nZzEtMTEwJyBkPSdNMS41OTQwMjItMS4zMDcwOThDMS42MTc5MzMtMS40MjY2NSAxLjY5NzYzNC0xLjcyOTUxNCAxLjcyMTU0NC0xLjg0OTA2NkMxLjgzMzEyNi0yLjI3OTQ1MiAxLjgzMzEyNi0yLjI4NzQyMiAyLjAxNjQzOC0yLjU1MDQzNkMyLjI3OTQ1Mi0yLjk0MDk3MSAyLjY1NDA0Ny0zLjI5MTY1NiAzLjE4ODA0NS0zLjI5MTY1NkMzLjQ3NDk2OS0zLjI5MTY1NiAzLjY0MjM0MS0zLjEyNDI4NCAzLjY0MjM0MS0yLjc0OTY4OUMzLjY0MjM0MS0yLjMxMTMzMyAzLjMwNzU5Ny0xLjQwMjc0IDMuMTU2MTY0LTEuMDEyMjA0QzMuMDUyNTUzLS43NDkxOTEgMy4wNTI1NTMtLjcwMTM3IDMuMDUyNTUzLS41OTc3NThDMy4wNTI1NTMtLjE0MzQ2MiAzLjQyNzE0OCAuMDc5NzAxIDMuNzY5ODYzIC4wNzk3MDFDNC41NTA5MzQgLjA3OTcwMSA0Ljg3NzcwOS0xLjAzNjExNSA0Ljg3NzcwOS0xLjEzOTcyNkM0Ljg3NzcwOS0xLjIxOTQyNyA0LjgxMzk0OC0xLjI0MzMzNyA0Ljc1ODE1Ny0xLjI0MzMzN0M0LjY2MjUxNi0xLjI0MzMzNyA0LjY0NjU3NS0xLjE4NzU0NyA0LjYyMjY2NS0xLjEwNzg0NkM0LjQzMTM4Mi0uNDU0Mjk2IDQuMDk2NjM4LS4xNDM0NjIgMy43OTM3NzMtLjE0MzQ2MkMzLjY2NjI1Mi0uMTQzNDYyIDMuNjAyNDkxLS4yMjMxNjMgMy42MDI0OTEtLjQwNjQ3NlMzLjY2NjI1Mi0uNzY1MTMxIDMuNzQ1OTUzLS45NjQzODRDMy44NjU1MDQtMS4yNjcyNDggNC4yMTYxODktMi4xODM4MTEgNC4yMTYxODktMi42MzAxMzdDNC4yMTYxODktMy4yMjc4OTUgMy44MDE3NDMtMy41MTQ4MTkgMy4yMjc4OTUtMy41MTQ4MTlDMi41ODIzMTYtMy41MTQ4MTkgMi4xNjc4Ny0zLjEyNDI4NCAxLjkzNjczNy0yLjgyMTQyQzEuODgwOTQ2LTMuMjU5Nzc2IDEuNTMwMjYyLTMuNTE0ODE5IDEuMTIzNzg2LTMuNTE0ODE5Qy44MzY4NjItMy41MTQ4MTkgLjYzNzYwOS0zLjMzMTUwNyAuNTEwMDg3LTMuMDg0NDMzQy4zMTg4MDQtMi43MDk4MzggLjIzOTEwMy0yLjMxMTMzMyAuMjM5MTAzLTIuMjk1MzkyQy4yMzkxMDMtMi4yMjM2NjEgLjI5NDg5NC0yLjE5MTc4MSAuMzU4NjU1LTIuMTkxNzgxQy40NjIyNjctMi4xOTE3ODEgLjQ3MDIzNy0yLjIyMzY2MSAuNTI2MDI3LTIuNDMwODg0Qy42MjE2NjktMi44MjE0MiAuNzY1MTMxLTMuMjkxNjU2IDEuMDk5ODc1LTMuMjkxNjU2QzEuMzA3MDk4LTMuMjkxNjU2IDEuMzU0OTE5LTMuMDkyNDAzIDEuMzU0OTE5LTIuOTE3MDYxQzEuMzU0OTE5LTIuNzczNTk5IDEuMzE1MDY4LTIuNjIyMTY3IDEuMjUxMzA4LTIuMzU5MTUzQzEuMjM1MzY3LTIuMjk1MzkyIDEuMTE1ODE2LTEuODI1MTU2IDEuMDgzOTM1LTEuNzEzNTc0TC43ODkwNDEtLjUxODA1N0MuNzU3MTYxLS4zOTg1MDYgLjcwOTM0LS4xOTkyNTMgLjcwOTM0LS4xNjczNzJDLjcwOTM0IC4wMTU5NCAuODYwNzcyIC4wNzk3MDEgLjk2NDM4NCAuMDc5NzAxQzEuMTA3ODQ2IC4wNzk3MDEgMS4yMjczOTctLjAxNTk0IDEuMjgzMTg4LS4xMTE1ODJDMS4zMDcwOTgtLjE1OTQwMiAxLjM3MDg1OS0uNDMwMzg2IDEuNDEwNzEtLjU5Nzc1OEwxLjU5NDAyMi0xLjMwNzA5OFonLz4KPHBhdGggaWQ9J2czLTQwJyBkPSdNMi42NTQwNDcgMS45OTI1MjhDMi43MTc4MDggMS45OTI1MjggMi44MTM0NSAxLjk5MjUyOCAyLjgxMzQ1IDEuODk2ODg3QzIuODEzNDUgMS44NjUwMDYgMi44MDU0NzkgMS44NTcwMzYgMi43MDE4NjggMS43NTM0MjVDMS42MDk5NjMgLjcyNTI4IDEuMzM4OTc5LS43NTcxNjEgMS4zMzg5NzktMS45OTI1MjhDMS4zMzg5NzktNC4yODc5MiAyLjI4NzQyMi01LjM2Mzg4NSAyLjY5Mzg5OC01LjczMDUxMUMyLjgwNTQ3OS01LjgzNDEyMiAyLjgxMzQ1LTUuODQyMDkyIDIuODEzNDUtNS44ODE5NDNTMi43ODE1NjktNS45Nzc1ODQgMi43MDE4NjgtNS45Nzc1ODRDMi41NzQzNDYtNS45Nzc1ODQgMi4xNzU4NDEtNS41NzExMDggMi4xMTIwOC01LjQ5OTM3N0MxLjA0NDA4NS00LjM4MzU2MiAuODIwOTIyLTIuOTQ4OTQxIC44MjA5MjItMS45OTI1MjhDLjgyMDkyMi0uMjA3MjIzIDEuNTcwMTEyIDEuMjI3Mzk3IDIuNjU0MDQ3IDEuOTkyNTI4WicvPgo8cGF0aCBpZD0nZzMtNDEnIGQ9J00yLjQ2Mjc2NS0xLjk5MjUyOEMyLjQ2Mjc2NS0yLjc0OTY4OSAyLjMzNTI0My0zLjY1ODI4MSAxLjg0MTA5Ni00LjU5ODc1NUMxLjQ1MDU2LTUuMzMyMDA1IC43MjUyOC01Ljk3NzU4NCAuNTgxODE4LTUuOTc3NTg0Qy41MDIxMTctNS45Nzc1ODQgLjQ3ODIwNy01LjkyMTc5MyAuNDc4MjA3LTUuODgxOTQzQy40NzgyMDctNS44NTAwNjIgLjQ3ODIwNy01LjgzNDEyMiAuNTczODQ4LTUuNzM4NDgxQzEuNjg5NjY0LTQuNjc4NDU2IDEuOTQ0NzA3LTMuMjE5OTI1IDEuOTQ0NzA3LTEuOTkyNTI4QzEuOTQ0NzA3IC4yOTQ4OTQgLjk5NjI2NCAxLjM3ODgyOSAuNTg5Nzg4IDEuNzQ1NDU1Qy40ODYxNzcgMS44NDkwNjYgLjQ3ODIwNyAxLjg1NzAzNiAuNDc4MjA3IDEuODk2ODg3Uy41MDIxMTcgMS45OTI1MjggLjU4MTgxOCAxLjk5MjUyOEMuNzA5MzQgMS45OTI1MjggMS4xMDc4NDYgMS41ODYwNTIgMS4xNzE2MDYgMS41MTQzMjFDMi4yMzk2MDEgLjM5ODUwNiAyLjQ2Mjc2NS0xLjAzNjExNSAyLjQ2Mjc2NS0xLjk5MjUyOFonLz4KPHBhdGggaWQ9J2czLTQzJyBkPSdNMy40NzQ5NjktMS44MDkyMTVINS44MTgxODJDNS45Mjk3NjMtMS44MDkyMTUgNi4xMDUxMDYtMS44MDkyMTUgNi4xMDUxMDYtMS45OTI1MjhTNS45Mjk3NjMtMi4xNzU4NDEgNS44MTgxODItMi4xNzU4NDFIMy40NzQ5NjlWLTQuNTI3MDI0QzMuNDc0OTY5LTQuNjM4NjA1IDMuNDc0OTY5LTQuODEzOTQ4IDMuMjkxNjU2LTQuODEzOTQ4UzMuMTA4MzQ0LTQuNjM4NjA1IDMuMTA4MzQ0LTQuNTI3MDI0Vi0yLjE3NTg0MUguNzU3MTYxQy42NDU1NzktMi4xNzU4NDEgLjQ3MDIzNy0yLjE3NTg0MSAuNDcwMjM3LTEuOTkyNTI4Uy42NDU1NzktMS44MDkyMTUgLjc1NzE2MS0xLjgwOTIxNUgzLjEwODM0NFYuNTQxOTY4QzMuMTA4MzQ0IC42NTM1NDkgMy4xMDgzNDQgLjgyODg5MiAzLjI5MTY1NiAuODI4ODkyUzMuNDc0OTY5IC42NTM1NDkgMy40NzQ5NjkgLjU0MTk2OFYtMS44MDkyMTVaJy8+CjxwYXRoIGlkPSdnMy00OScgZD0nTTIuNTAyNjE1LTUuMDc2OTYxQzIuNTAyNjE1LTUuMjkyMTU0IDIuNDg2Njc1LTUuMzAwMTI1IDIuMjcxNDgyLTUuMzAwMTI1QzEuOTQ0NzA3LTQuOTgxMzIgMS41MjIyOTEtNC43OTAwMzcgLjc2NTEzMS00Ljc5MDAzN1YtNC41MjcwMjRDLjk4MDMyNC00LjUyNzAyNCAxLjQxMDcxLTQuNTI3MDI0IDEuODcyOTc2LTQuNzQyMjE3Vi0uNjUzNTQ5QzEuODcyOTc2LS4zNTg2NTUgMS44NDkwNjYtLjI2MzAxNCAxLjA5MTkwNS0uMjYzMDE0SC44MTI5NTFWMEMxLjEzOTcyNi0uMDIzOTEgMS44MjUxNTYtLjAyMzkxIDIuMTgzODExLS4wMjM5MVMzLjIzNTg2Ni0uMDIzOTEgMy41NjI2NCAwVi0uMjYzMDE0SDMuMjgzNjg2QzIuNTI2NTI2LS4yNjMwMTQgMi41MDI2MTUtLjM1ODY1NSAyLjUwMjYxNS0uNjUzNTQ5Vi01LjA3Njk2MVonLz4KPHBhdGggaWQ9J2czLTkxJyBkPSdNMi4xNTk5IDEuOTkyNTI4VjEuNjI1OTAzSDEuMzU0OTE5Vi01LjYxMDk1OUgyLjE1OTlWLTUuOTc3NTg0SC45ODgyOTRWMS45OTI1MjhIMi4xNTk5WicvPgo8cGF0aCBpZD0nZzMtOTMnIGQ9J00xLjM1NDkxOS01Ljk3NzU4NEguMTgzMzEzVi01LjYxMDk1OUguOTg4Mjk0VjEuNjI1OTAzSC4xODMzMTNWMS45OTI1MjhIMS4zNTQ5MTlWLTUuOTc3NTg0WicvPgo8cGF0aCBpZD0nZzItMTEnIGQ9J001LjUzNTI0My0zLjAyNDY1OEM1LjUzNTI0My00LjE4NDMwOSA0Ljg3NzcwOS01LjI3MjIyOSAzLjYxMDQ2MS01LjI3MjIyOUMyLjA0NDMzNC01LjI3MjIyOSAuNDc4MjA3LTMuNTYyNjQgLjQ3ODIwNy0xLjg2NTAwNkMuNDc4MjA3LS44MjQ5MDcgMS4xMjM3ODYgLjExOTU1MiAyLjM0MzIxMyAuMTE5NTUyQzMuMDg0NDMzIC4xMTk1NTIgMy45NjkxMTYtLjE2NzM3MiA0LjgxNzkzMy0uODg0NjgyQzQuOTg1MzA1LS4yMTUxOTMgNS4zNTU5MTUgLjExOTU1MiA1Ljg2OTk4OCAuMTE5NTUyQzYuNTE1NTY3IC4xMTk1NTIgNi44MzgzNTYtLjU0OTkzOCA2LjgzODM1Ni0uNzA1MzU1QzYuODM4MzU2LS44MTI5NTEgNi43NTQ2Ny0uODEyOTUxIDYuNzE4ODA0LS44MTI5NTFDNi42MjMxNjMtLjgxMjk1MSA2LjYxMTIwOC0uNzc3MDg2IDYuNTc1MzQyLS42ODE0NDVDNi40Njc3NDYtLjM4MjU2NSA2LjE5Mjc3Ny0uMTE5NTUyIDUuOTA1ODUzLS4xMTk1NTJDNS41MzUyNDMtLjExOTU1MiA1LjUzNTI0My0uODg0NjgyIDUuNTM1MjQzLTEuNjEzOTQ4QzYuNzU0NjctMy4wNzI0NzggNy4wNDE1OTQtNC41Nzg4MjkgNy4wNDE1OTQtNC41OTA3ODVDNy4wNDE1OTQtNC42OTgzODEgNi45NDU5NTMtNC42OTgzODEgNi45MTAwODctNC42OTgzODFDNi44MDI0OTEtNC42OTgzODEgNi43OTA1MzUtNC42NjI1MTYgNi43NDI3MTUtNC40NDczMjNDNi41ODcyOTgtMy45MjEyOTUgNi4yNzY0NjMtMi45ODg3OTIgNS41MzUyNDMtMi4wMDg0NjhWLTMuMDI0NjU4Wk00Ljc4MjA2Ny0xLjE3MTYwNkMzLjczMDAxMi0uMjI3MTQ4IDIuNzg1NTU0LS4xMTk1NTIgMi4zNjcxMjMtLjExOTU1MkMxLjUxODMwNi0uMTE5NTUyIDEuMjc5MjAzLS44NzI3MjcgMS4yNzkyMDMtMS40MzQ2MkMxLjI3OTIwMy0xLjk0ODY5MiAxLjU0MjIxNy0zLjE2ODEyIDEuOTEyODI3LTMuODI1NjU0QzIuNDAyOTg5LTQuNjYyNTE2IDMuMDcyNDc4LTUuMDMzMTI2IDMuNjEwNDYxLTUuMDMzMTI2QzQuNzcwMTEyLTUuMDMzMTI2IDQuNzcwMTEyLTMuNTE0ODE5IDQuNzcwMTEyLTIuNTEwNTg1QzQuNzcwMTEyLTIuMjExNzA2IDQuNzU4MTU3LTEuOTAwODcyIDQuNzU4MTU3LTEuNjAxOTkzQzQuNzU4MTU3LTEuMzYyODg5IDQuNzcwMTEyLTEuMzAzMTEzIDQuNzgyMDY3LTEuMTcxNjA2WicvPgo8cGF0aCBpZD0nZzItMTEzJyBkPSdNNS4yNzIyMjktNS4xNTI2NzdDNS4yNzIyMjktNS4yMTI0NTMgNS4yMjQ0MDgtNS4yNjAyNzQgNS4xNjQ2MzMtNS4yNjAyNzRDNS4wNjg5OTEtNS4yNjAyNzQgNC42MDI3NC00LjgyOTg4OCA0LjM3NTU5Mi00LjQxMTQ1N0M0LjE2MDM5OS00Ljk0OTQ0IDMuNzg5Nzg4LTUuMjcyMjI5IDMuMjc1NzE2LTUuMjcyMjI5QzEuOTI0NzgyLTUuMjcyMjI5IC40NjYyNTItMy41MjY3NzUgLjQ2NjI1Mi0xLjc1NzQxQy40NjYyNTItLjU3Mzg0OCAxLjE1OTY1MSAuMTE5NTUyIDEuOTcyNjAzIC4xMTk1NTJDMi42MDYyMjcgLjExOTU1MiAzLjEzMjI1NC0uMzU4NjU1IDMuMzgzMzEzLS42MzM2MjRMMy4zOTUyNjgtLjYyMTY2OUwyLjk0MDk3MSAxLjE3MTYwNkwyLjgzMzM3NSAxLjYwMTk5M0MyLjcyNTc3OCAxLjk2MDY0OCAyLjU0NjQ1MSAxLjk2MDY0OCAxLjk4NDU1OCAxLjk3MjYwM0MxLjg1MzA1MSAxLjk3MjYwMyAxLjczMzQ5OSAxLjk3MjYwMyAxLjczMzQ5OSAyLjE5OTc1MUMxLjczMzQ5OSAyLjI4MzQzNyAxLjgwNTIzIDIuMzE5MzAzIDEuODg4OTE3IDIuMzE5MzAzQzIuMDU2Mjg5IDIuMzE5MzAzIDIuMjcxNDgyIDIuMjk1MzkyIDIuNDM4ODU0IDIuMjk1MzkySDMuNjU4MjgxQzMuODM3NjA5IDIuMjk1MzkyIDQuMDQwODQ3IDIuMzE5MzAzIDQuMjIwMTc0IDIuMzE5MzAzQzQuMjkxOTA1IDIuMzE5MzAzIDQuNDM1MzY3IDIuMzE5MzAzIDQuNDM1MzY3IDIuMDkyMTU0QzQuNDM1MzY3IDEuOTcyNjAzIDQuMzM5NzI2IDEuOTcyNjAzIDQuMTYwMzk5IDEuOTcyNjAzQzMuNTk4NTA2IDEuOTcyNjAzIDMuNTYyNjQgMS44ODg5MTcgMy41NjI2NCAxLjc5MzI3NUMzLjU2MjY0IDEuNzMzNDk5IDMuNTc0NTk1IDEuNzIxNTQ0IDMuNjEwNDYxIDEuNTY2MTI3TDUuMjcyMjI5LTUuMTUyNjc3Wk0zLjU4NjU1LTEuNDIyNjY1QzMuNTI2Nzc1LTEuMjE5NDI3IDMuNTI2Nzc1LTEuMTk1NTE3IDMuMzU5NDAyLS45NjgzNjlDMy4wOTYzODktLjYzMzYyNCAyLjU3MDM2MS0uMTE5NTUyIDIuMDA4NDY4LS4xMTk1NTJDMS41MTgzMDYtLjExOTU1MiAxLjI0MzMzNy0uNTYxODkzIDEuMjQzMzM3LTEuMjY3MjQ4QzEuMjQzMzM3LTEuOTI0NzgyIDEuNjEzOTQ4LTMuMjYzNzYxIDEuODQxMDk2LTMuNzY1ODc4QzIuMjQ3NTcyLTQuNjAyNzQgMi44MDk0NjUtNS4wMzMxMjYgMy4yNzU3MTYtNS4wMzMxMjZDNC4wNjQ3NTctNS4wMzMxMjYgNC4yMjAxNzQtNC4wNTI4MDIgNC4yMjAxNzQtMy45NTcxNjFDNC4yMjAxNzQtMy45NDUyMDUgNC4xODQzMDktMy43ODk3ODggNC4xNzIzNTQtMy43NjU4NzhMMy41ODY1NS0xLjQyMjY2NVonLz4KPHBhdGggaWQ9J2cyLTEyMCcgZD0nTTUuNjY2NzUtNC44Nzc3MDlDNS4yODQxODQtNC44MDU5NzggNS4xNDA3MjItNC41MTkwNTQgNS4xNDA3MjItNC4yOTE5MDVDNS4xNDA3MjItNC4wMDQ5ODEgNS4zNjc4Ny0zLjkwOTM0IDUuNTM1MjQzLTMuOTA5MzRDNS44OTM4OTgtMy45MDkzNCA2LjE0NDk1Ni00LjIyMDE3NCA2LjE0NDk1Ni00LjU0Mjk2NEM2LjE0NDk1Ni01LjA0NTA4MSA1LjU3MTEwOC01LjI3MjIyOSA1LjA2ODk5MS01LjI3MjIyOUM0LjMzOTcyNi01LjI3MjIyOSAzLjkzMzI1LTQuNTU0OTE5IDMuODI1NjU0LTQuMzI3NzcxQzMuNTUwNjg1LTUuMjI0NDA4IDIuODA5NDY1LTUuMjcyMjI5IDIuNTk0MjcxLTUuMjcyMjI5QzEuMzc0ODQ0LTUuMjcyMjI5IC43MjkyNjUtMy43MDYxMDIgLjcyOTI2NS0zLjQ0MzA4OEMuNzI5MjY1LTMuMzk1MjY4IC43NzcwODYtMy4zMzU0OTIgLjg2MDc3Mi0zLjMzNTQ5MkMuOTU2NDEzLTMuMzM1NDkyIC45ODAzMjQtMy40MDcyMjMgMS4wMDQyMzQtMy40NTUwNDRDMS40MTA3MS00Ljc4MjA2NyAyLjIxMTcwNi01LjAzMzEyNiAyLjU1ODQwNi01LjAzMzEyNkMzLjA5NjM4OS01LjAzMzEyNiAzLjIwMzk4NS00LjUzMTAwOSAzLjIwMzk4NS00LjI0NDA4NUMzLjIwMzk4NS0zLjk4MTA3MSAzLjEzMjI1NC0zLjcwNjEwMiAyLjk4ODc5Mi0zLjEzMjI1NEwyLjU4MjMxNi0xLjQ5NDM5NkMyLjQwMjk4OS0uNzc3MDg2IDIuMDU2Mjg5LS4xMTk1NTIgMS40MjI2NjUtLjExOTU1MkMxLjM2Mjg4OS0uMTE5NTUyIDEuMDY0MDEtLjExOTU1MiAuODEyOTUxLS4yNzQ5NjlDMS4yNDMzMzctLjM1ODY1NSAxLjMzODk3OS0uNzE3MzEgMS4zMzg5NzktLjg2MDc3MkMxLjMzODk3OS0xLjA5OTg3NSAxLjE1OTY1MS0xLjI0MzMzNyAuOTMyNTAzLTEuMjQzMzM3Qy42NDU1NzktMS4yNDMzMzcgLjMzNDc0NS0uOTkyMjc5IC4zMzQ3NDUtLjYwOTcxNEMuMzM0NzQ1LS4xMDc1OTcgLjg5NjYzOCAuMTE5NTUyIDEuNDEwNzEgLjExOTU1MkMxLjk4NDU1OCAuMTE5NTUyIDIuMzkxMDM0LS4zMzQ3NDUgMi42NDIwOTItLjgyNDkwN0MyLjgzMzM3NS0uMTE5NTUyIDMuNDMxMTMzIC4xMTk1NTIgMy44NzM0NzQgLjExOTU1MkM1LjA5MjkwMiAuMTE5NTUyIDUuNzM4NDgxLTEuNDQ2NTc1IDUuNzM4NDgxLTEuNzA5NTg5QzUuNzM4NDgxLTEuNzY5MzY1IDUuNjkwNjYtMS44MTcxODYgNS42MTg5MjktMS44MTcxODZDNS41MTEzMzMtMS44MTcxODYgNS40OTkzNzctMS43NTc0MSA1LjQ2MzUxMi0xLjY2MTc2OEM1LjE0MDcyMi0uNjA5NzE0IDQuNDQ3MzIzLS4xMTk1NTIgMy45MDkzNC0uMTE5NTUyQzMuNDkwOTA5LS4xMTk1NTIgMy4yNjM3NjEtLjQzMDM4NiAzLjI2Mzc2MS0uOTIwNTQ4QzMuMjYzNzYxLTEuMTgzNTYyIDMuMzExNTgyLTEuMzc0ODQ0IDMuNTAyODY0LTIuMTYzODg1TDMuOTIxMjk1LTMuNzg5Nzg4QzQuMTAwNjIzLTQuNTA3MDk4IDQuNTA3MDk4LTUuMDMzMTI2IDUuMDU3MDM2LTUuMDMzMTI2QzUuMDgwOTQ2LTUuMDMzMTI2IDUuNDE1NjkxLTUuMDMzMTI2IDUuNjY2NzUtNC44Nzc3MDlaJy8+CjxwYXRoIGlkPSdnMC05OCcgZD0nTTMuMzExNTgyLTguMTg5MjlMNi41NjMzODctNi43MTg4MDRMNi43MDY4NDktNi45ODE4MThMMy4zMjM1MzctOC44OTQ2NDVMLS4wNTk3NzYtNi45ODE4MThMLjA3MTczMS02LjcxODgwNEwzLjMxMTU4Mi04LjE4OTI5WicvPgo8L2RlZnM+CjxnIGlkPSdwYWdlMSc+Cjx1c2UgeD0nMTUxLjk5MjA4NycgeT0nLTQuNDgzMzEnIHhsaW5rOmhyZWY9JyNnMC05OCcvPgo8dXNlIHg9JzE1MS41Mjc5MDEnIHk9Jy00LjQ4MzI5NCcgeGxpbms6aHJlZj0nI2cyLTExMycvPgo8dXNlIHg9JzE1Ni43MTgxMDgnIHk9Jy0yLjY5MDAzMScgeGxpbms6aHJlZj0nI2cxLTg4Jy8+Cjx1c2UgeD0nMTY0LjgwMzE2MScgeT0nLTQuNDgzMjk0JyB4bGluazpocmVmPScjZzQtNDAnLz4KPHVzZSB4PScxNjkuMzU1NDg3JyB5PSctNC40ODMyOTQnIHhsaW5rOmhyZWY9JyNnMi0xMScvPgo8dXNlIHg9JzE3Ni44NzcyMTEnIHk9Jy00LjQ4MzI5NCcgeGxpbms6aHJlZj0nI2c0LTQxJy8+Cjx1c2UgeD0nMTg0Ljc1MDM2NicgeT0nLTQuNDgzMjk0JyB4bGluazpocmVmPScjZzQtNjEnLz4KPHVzZSB4PScxOTcuMTc1ODQ3JyB5PSctNC40ODMyOTQnIHhsaW5rOmhyZWY9JyNnMi0xMjAnLz4KPHVzZSB4PScyMDMuODI3OTM0JyB5PSctMi42MjM1ODQnIHhsaW5rOmhyZWY9JyNnMy00MCcvPgo8dXNlIHg9JzIwNy4xMjExODgnIHk9Jy0yLjYyMzU4NCcgeGxpbms6aHJlZj0nI2czLTkxJy8+Cjx1c2UgeD0nMjA5LjQ3MzUxMScgeT0nLTIuNjIzNTg0JyB4bGluazpocmVmPScjZzEtMTEwJy8+Cjx1c2UgeD0nMjE0LjYxMTcxNCcgeT0nLTIuNjIzNTg0JyB4bGluazpocmVmPScjZzEtMTEnLz4KPHVzZSB4PScyMjAuMDUwNjUzJyB5PSctMi42MjM1ODQnIHhsaW5rOmhyZWY9JyNnMy05MycvPgo8dXNlIHg9JzIyMi40MDI5NzcnIHk9Jy0yLjYyMzU4NCcgeGxpbms6aHJlZj0nI2czLTQzJy8+Cjx1c2UgeD0nMjI4Ljk4OTQ4NCcgeT0nLTIuNjIzNTg0JyB4bGluazpocmVmPScjZzMtNDknLz4KPHVzZSB4PScyMzMuMjIzNjY2JyB5PSctMi42MjM1ODQnIHhsaW5rOmhyZWY9JyNnMy00MScvPgo8L2c+Cjwvc3ZnPgo8IS0tIERFUFRIPTAgLS0+)
where ![[\sampleSize\alpha]](data:image/svg+xml;base64,PD94bWwgdmVyc2lvbj0nMS4wJyBlbmNvZGluZz0nVVRGLTgnPz4KPCEtLSBUaGlzIGZpbGUgd2FzIGdlbmVyYXRlZCBieSBkdmlzdmdtIDMuNC4yIC0tPgo8c3ZnIHZlcnNpb249JzEuMScgeG1sbnM9J2h0dHA6Ly93d3cudzMub3JnLzIwMDAvc3ZnJyB4bWxuczp4bGluaz0naHR0cDovL3d3dy53My5vcmcvMTk5OS94bGluaycgd2lkdGg9JzIxLjAxMjY1MnB0JyBoZWlnaHQ9JzExLjk1NTE2OHB0JyB2aWV3Qm94PScwIC04Ljk2NjM3NiAyMS4wMTI2NTIgMTEuOTU1MTY4Jz4KPGRlZnM+CjxwYXRoIGlkPSdnMC0xMScgZD0nTTUuNTM1MjQzLTMuMDI0NjU4QzUuNTM1MjQzLTQuMTg0MzA5IDQuODc3NzA5LTUuMjcyMjI5IDMuNjEwNDYxLTUuMjcyMjI5QzIuMDQ0MzM0LTUuMjcyMjI5IC40NzgyMDctMy41NjI2NCAuNDc4MjA3LTEuODY1MDA2Qy40NzgyMDctLjgyNDkwNyAxLjEyMzc4NiAuMTE5NTUyIDIuMzQzMjEzIC4xMTk1NTJDMy4wODQ0MzMgLjExOTU1MiAzLjk2OTExNi0uMTY3MzcyIDQuODE3OTMzLS44ODQ2ODJDNC45ODUzMDUtLjIxNTE5MyA1LjM1NTkxNSAuMTE5NTUyIDUuODY5OTg4IC4xMTk1NTJDNi41MTU1NjcgLjExOTU1MiA2LjgzODM1Ni0uNTQ5OTM4IDYuODM4MzU2LS43MDUzNTVDNi44MzgzNTYtLjgxMjk1MSA2Ljc1NDY3LS44MTI5NTEgNi43MTg4MDQtLjgxMjk1MUM2LjYyMzE2My0uODEyOTUxIDYuNjExMjA4LS43NzcwODYgNi41NzUzNDItLjY4MTQ0NUM2LjQ2Nzc0Ni0uMzgyNTY1IDYuMTkyNzc3LS4xMTk1NTIgNS45MDU4NTMtLjExOTU1MkM1LjUzNTI0My0uMTE5NTUyIDUuNTM1MjQzLS44ODQ2ODIgNS41MzUyNDMtMS42MTM5NDhDNi43NTQ2Ny0zLjA3MjQ3OCA3LjA0MTU5NC00LjU3ODgyOSA3LjA0MTU5NC00LjU5MDc4NUM3LjA0MTU5NC00LjY5ODM4MSA2Ljk0NTk1My00LjY5ODM4MSA2LjkxMDA4Ny00LjY5ODM4MUM2LjgwMjQ5MS00LjY5ODM4MSA2Ljc5MDUzNS00LjY2MjUxNiA2Ljc0MjcxNS00LjQ0NzMyM0M2LjU4NzI5OC0zLjkyMTI5NSA2LjI3NjQ2My0yLjk4ODc5MiA1LjUzNTI0My0yLjAwODQ2OFYtMy4wMjQ2NThaTTQuNzgyMDY3LTEuMTcxNjA2QzMuNzMwMDEyLS4yMjcxNDggMi43ODU1NTQtLjExOTU1MiAyLjM2NzEyMy0uMTE5NTUyQzEuNTE4MzA2LS4xMTk1NTIgMS4yNzkyMDMtLjg3MjcyNyAxLjI3OTIwMy0xLjQzNDYyQzEuMjc5MjAzLTEuOTQ4NjkyIDEuNTQyMjE3LTMuMTY4MTIgMS45MTI4MjctMy44MjU2NTRDMi40MDI5ODktNC42NjI1MTYgMy4wNzI0NzgtNS4wMzMxMjYgMy42MTA0NjEtNS4wMzMxMjZDNC43NzAxMTItNS4wMzMxMjYgNC43NzAxMTItMy41MTQ4MTkgNC43NzAxMTItMi41MTA1ODVDNC43NzAxMTItMi4yMTE3MDYgNC43NTgxNTctMS45MDA4NzIgNC43NTgxNTctMS42MDE5OTNDNC43NTgxNTctMS4zNjI4ODkgNC43NzAxMTItMS4zMDMxMTMgNC43ODIwNjctMS4xNzE2MDZaJy8+CjxwYXRoIGlkPSdnMC0xMTAnIGQ9J00yLjQ2Mjc2NS0zLjUwMjg2NEMyLjQ4NjY3NS0zLjU3NDU5NSAyLjc4NTU1NC00LjE3MjM1NCAzLjIyNzg5NS00LjU1NDkxOUMzLjUzODczLTQuODQxODQzIDMuOTQ1MjA1LTUuMDMzMTI2IDQuNDExNDU3LTUuMDMzMTI2QzQuODg5NjY0LTUuMDMzMTI2IDUuMDU3MDM2LTQuNjc0NDcxIDUuMDU3MDM2LTQuMTk2MjY0QzUuMDU3MDM2LTMuNTE0ODE5IDQuNTY2ODc0LTIuMTUxOTMgNC4zMjc3NzEtMS41MDYzNTFDNC4yMjAxNzQtMS4yMTk0MjcgNC4xNjAzOTktMS4wNjQwMSA0LjE2MDM5OS0uODQ4ODE3QzQuMTYwMzk5LS4zMTA4MzQgNC41MzEwMDkgLjExOTU1MiA1LjEwNDg1NyAuMTE5NTUyQzYuMjE2Njg3IC4xMTk1NTIgNi42MzUxMTgtMS42Mzc4NTggNi42MzUxMTgtMS43MDk1ODlDNi42MzUxMTgtMS43NjkzNjUgNi41ODcyOTgtMS44MTcxODYgNi41MTU1NjctMS44MTcxODZDNi40MDc5Ny0xLjgxNzE4NiA2LjM5NjAxNS0xLjc4MTMyIDYuMzM2MjM5LTEuNTc4MDgyQzYuMDYxMjctLjU5Nzc1OCA1LjYwNjk3NC0uMTE5NTUyIDUuMTQwNzIyLS4xMTk1NTJDNS4wMjExNzEtLjExOTU1MiA0LjgyOTg4OC0uMTMxNTA3IDQuODI5ODg4LS41MTQwNzJDNC44Mjk4ODgtLjgxMjk1MSA0Ljk2MTM5NS0xLjE3MTYwNiA1LjAzMzEyNi0xLjMzODk3OUM1LjI3MjIyOS0xLjk5NjUxMyA1Ljc3NDM0Ni0zLjMzNTQ5MiA1Ljc3NDM0Ni00LjAxNjkzNkM1Ljc3NDM0Ni00LjczNDI0NyA1LjM1NTkxNS01LjI3MjIyOSA0LjQ0NzMyMy01LjI3MjIyOUMzLjM4MzMxMy01LjI3MjIyOSAyLjgyMTQyLTQuNTE5MDU0IDIuNjA2MjI3LTQuMjIwMTc0QzIuNTcwMzYxLTQuOTAxNjE5IDIuMDgwMTk5LTUuMjcyMjI5IDEuNTU0MTcyLTUuMjcyMjI5QzEuMTcxNjA2LTUuMjcyMjI5IC45MDg1OTMtNS4wNDUwODEgLjcwNTM1NS00LjYzODYwNUMuNDkwMTYyLTQuMjA4MjE5IC4zMjI3OS0zLjQ5MDkwOSAuMzIyNzktMy40NDMwODhTLjM3MDYxLTMuMzM1NDkyIC40NTQyOTYtMy4zMzU0OTJDLjU0OTkzOC0zLjMzNTQ5MiAuNTYxODkzLTMuMzQ3NDQ3IC42MzM2MjQtMy42MjI0MTZDLjgyNDkwNy00LjM1MTY4MSAxLjA0MDEtNS4wMzMxMjYgMS41MTgzMDYtNS4wMzMxMjZDMS43OTMyNzUtNS4wMzMxMjYgMS44ODg5MTctNC44NDE4NDMgMS44ODg5MTctNC40ODMxODhDMS44ODg5MTctNC4yMjAxNzQgMS43NjkzNjUtMy43NTM5MjMgMS42ODU2NzktMy4zODMzMTNMMS4zNTA5MzQtMi4wOTIxNTRDMS4zMDMxMTMtMS44NjUwMDYgMS4xNzE2MDYtMS4zMjcwMjQgMS4xMTE4MzEtMS4xMTE4MzFDMS4wMjgxNDQtLjgwMDk5NiAuODk2NjM4LS4yMzkxMDMgLjg5NjYzOC0uMTc5MzI4Qy44OTY2MzgtLjAxMTk1NSAxLjAyODE0NCAuMTE5NTUyIDEuMjA3NDcyIC4xMTk1NTJDMS4zNTA5MzQgLjExOTU1MiAxLjUxODMwNiAuMDQ3ODIxIDEuNjEzOTQ4LS4xMzE1MDdDMS42Mzc4NTgtLjE5MTI4MyAxLjc0NTQ1NS0uNjA5NzE0IDEuODA1MjMtLjg0ODgxN0wyLjA2ODI0NC0xLjkyNDc4MkwyLjQ2Mjc2NS0zLjUwMjg2NFonLz4KPHBhdGggaWQ9J2cxLTkxJyBkPSdNMi45ODg3OTIgMi45ODg3OTJWMi41NDY0NTFIMS44MjkxNDFWLTguNTI0MDM1SDIuOTg4NzkyVi04Ljk2NjM3NkgxLjM4NjhWMi45ODg3OTJIMi45ODg3OTJaJy8+CjxwYXRoIGlkPSdnMS05MycgZD0nTTEuODUzMDUxLTguOTY2Mzc2SC4yNTEwNTlWLTguNTI0MDM1SDEuNDEwNzFWMi41NDY0NTFILjI1MTA1OVYyLjk4ODc5MkgxLjg1MzA1MVYtOC45NjYzNzZaJy8+CjwvZGVmcz4KPGcgaWQ9J3BhZ2UxJz4KPHVzZSB4PScwJyB5PScwJyB4bGluazpocmVmPScjZzEtOTEnLz4KPHVzZSB4PSczLjI1MTY2MScgeT0nMCcgeGxpbms6aHJlZj0nI2cwLTExMCcvPgo8dXNlIHg9JzEwLjIzOTI2NycgeT0nMCcgeGxpbms6aHJlZj0nI2cwLTExJy8+Cjx1c2UgeD0nMTcuNzYwOTkxJyB5PScwJyB4bGluazpocmVmPScjZzEtOTMnLz4KPC9nPgo8L3N2Zz4KPCEtLSBERVBUSD00IC0tPg==) denotes the integral part of
denotes the integral part of  and
and  is the sample sorted in ascended order:

Thus, the  smallest value of the sample
 is an estimate
  of the
-quantile where
of the
-quantile where  , for
, for  .
.
The QQ-plot draws the couples of empirical quantiles of the same order from both samples:
 .
If both samples follow the same distribution, then the points should be close to the diagonal.
.
If both samples follow the same distribution, then the points should be close to the diagonal.
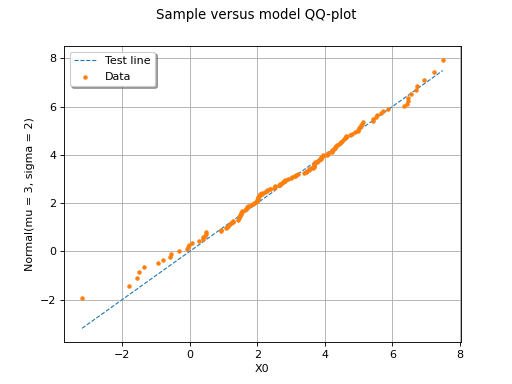
The following figure illustrates a QQ-plot with two
samples of size  . In this example, the
points remain close to the diagonal and the hypothesis
“Both samples are drawn from the same distribution” does not seem false,
even if a more quantitative analysis should be
carried out to confirm this.
. In this example, the
points remain close to the diagonal and the hypothesis
“Both samples are drawn from the same distribution” does not seem false,
even if a more quantitative analysis should be
carried out to confirm this.
(Source code, png)
(Source code, png)

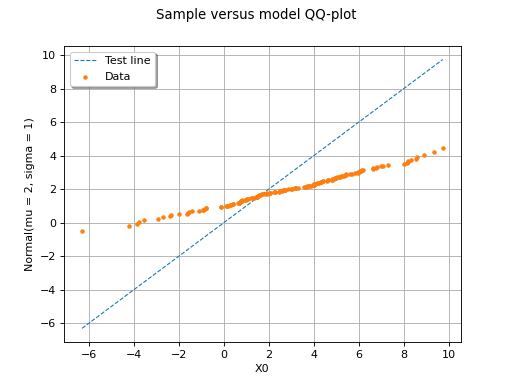
In this second example, the two samples clearly arise from two different distributions.