Note
Go to the end to download the full example code.
Create an extreme value distribution
Abstract
In this example we show how to define extreme values distributions.
import openturns as ot
import openturns.viewer as otv
from matplotlib import pylab as plt

ot.Log.Show(ot.Log.NONE)
The generalized extreme value distribution (GEV)
The GeneralizedExtremeValue distribution is a family of continuous probability distributions
that combine the Gumbel, Frechet and WeibullMax distribution,
all extreme value distribution.
We define a generalized extreme value distribution with parameters  ,
,  and
and 
myDistribution = ot.GeneralizedExtremeValue(0.0, 1.0, 0.0)
The GeneralizedExtremeValue class acts as a proxy class. We can get the actual distribution (Weibull, Frechet or Gumbel) with the getActualDistribution method :
print(myDistribution.getActualDistribution())
Gumbel(beta = 1, gamma = 0)
For the chosen parameters it is a Gumbel distribution with parameters
 and
and  .
.
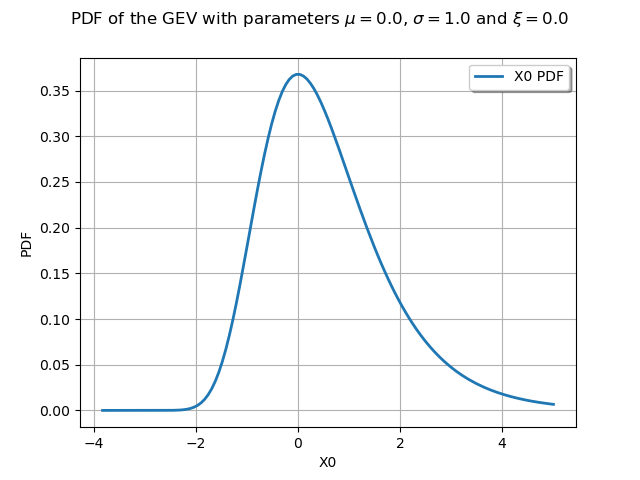
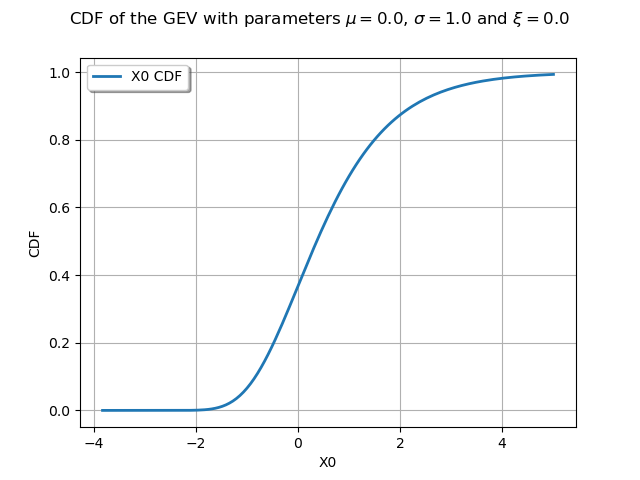
We draw its PDF and CDF :
graphPDF = myDistribution.drawPDF()
graphPDF.setTitle(
    r"PDF of the GEV with parameters $\mu = 0.0$, $\sigma = 1.0$ and $\xi = 0.0$ "
)
view = otv.View(graphPDF)

graphCDF = myDistribution.drawCDF()
graphCDF.setTitle(
    r"CDF of the GEV with parameters $\mu = 0.0$, $\sigma = 1.0$ and $\xi = 0.0$ "
)
view = otv.View(graphCDF)
The Generalized Pareto Distribution (GPD)
In this paragraph we turn to the definition of a GeneralizedPareto distribution.
For instance we build a generalized Pareto distribution with parameters , and  :
:
myGPD = ot.GeneralizedPareto(1.0, 0.0, 0.0)
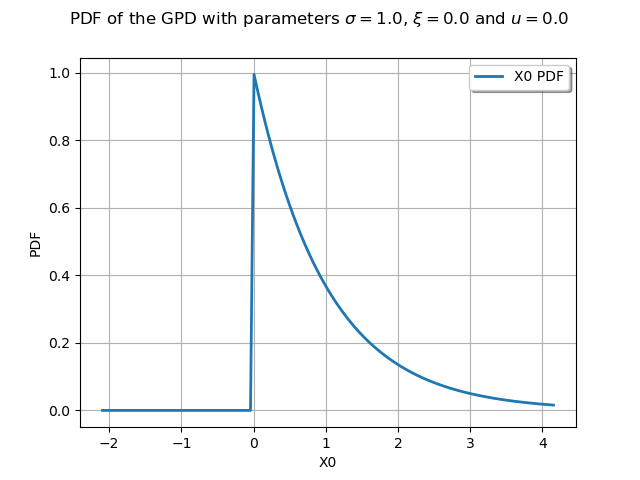
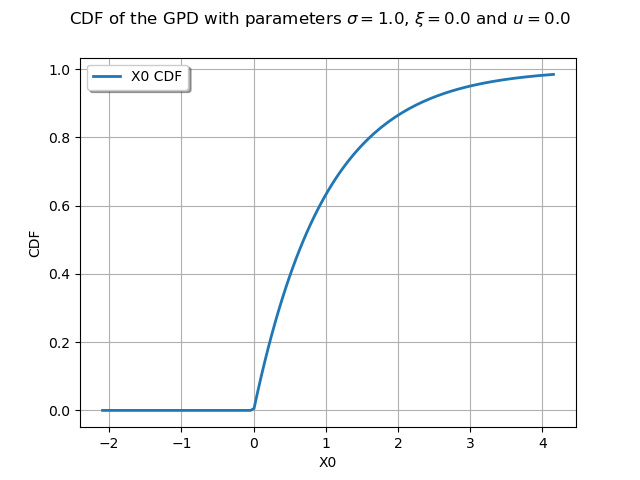
We draw its PDF and CDF :
graphPDF = myGPD.drawPDF()
graphPDF.setTitle(
    r"PDF of the GPD with parameters $\sigma = 1.0$, $\xi = 0.0$ and $u = 0.0$ "
)
view = otv.View(graphPDF)
graphCDF = myGPD.drawCDF()
graphCDF.setTitle(
    r"CDF of the GPD with parameters $\sigma = 1.0$, $\xi = 0.0$ and $u = 0.0$ "
)
view = otv.View(graphCDF)
Display all figures
plt.show()