Note
Go to the end to download the full example code.
Draw minimum volume level sets
import openturns as ot
import openturns.viewer as viewer
from matplotlib import pylab as plt

ot.Log.Show(ot.Log.NONE)
Draw minimum volume level set in 1D
In this paragraph, we compute the minimum volume level set of a univariate distribution.
With a Normal, minimum volume LevelSet
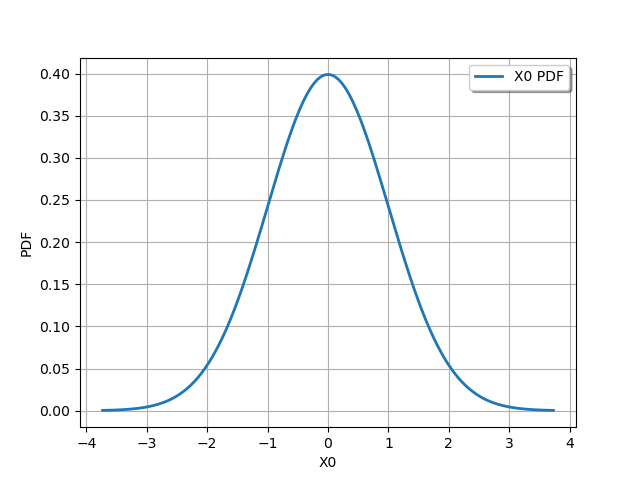
n = ot.Normal()
graph = n.drawPDF()
view = viewer.View(graph)
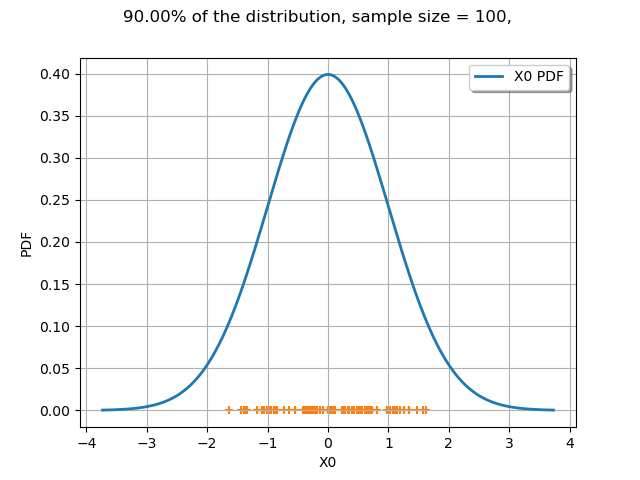
We want to compute the minimum volume LevelSet which contains alpha = 90% of the distribution. The threshold is the value of the PDF corresponding the alpha-probability: the points contained in the LevelSet have a PDF value lower or equal to this threshold.
alpha = 0.9
levelSet, threshold = n.computeMinimumVolumeLevelSetWithThreshold(alpha)
threshold
0.10313564037537133
The LevelSet has a contains method. Obviously, the point 0 is in the LevelSet.
levelSet.contains([0.0])
True
def computeSampleInLevelSet(distribution, levelSet, sampleSize=1000):
    """
    Generate a sample from given distribution.
    Extract the sub-sample which is contained in the levelSet.
    """
    sample = distribution.getSample(sampleSize)
    dim = distribution.getDimension()
    # Get the list of points in the LevelSet.
    inLevelSet = []
    for x in sample:
        if levelSet.contains(x):
            inLevelSet.append(x)
    # Extract the sub-sample of the points in the LevelSet
    numberOfPointsInLevelSet = len(inLevelSet)
    inLevelSetSample = ot.Sample(numberOfPointsInLevelSet, dim)
    for i in range(numberOfPointsInLevelSet):
        inLevelSetSample[i] = inLevelSet[i]
    return inLevelSetSample
def from1Dto2Dsample(oldSample):
    """
    Create a 2D sample from a 1D sample with zero ordinate (for the graph).
    """
    size = oldSample.getSize()
    newSample = ot.Sample(size, 2)
    for i in range(size):
        newSample[i, 0] = oldSample[i, 0]
    return newSample
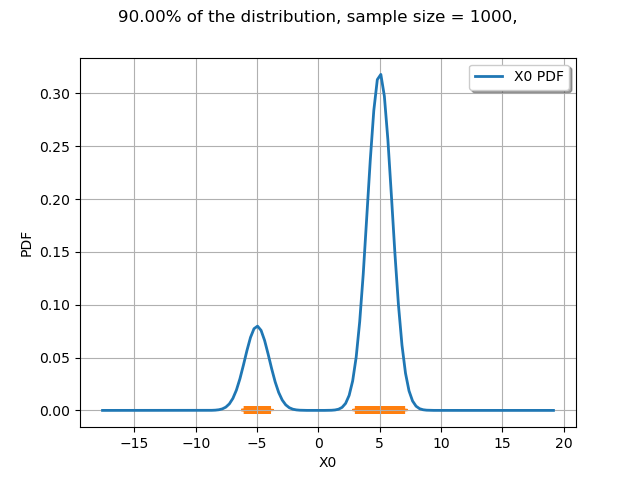
def drawLevelSet1D(distribution, levelSet, alpha, threshold, sampleSize=100):
    """
    Draw a 1D sample included in a given levelSet.
    The sample is generated from the distribution.
    """
    inLevelSample = computeSampleInLevelSet(distribution, levelSet, sampleSize)
    cloudSample = from1Dto2Dsample(inLevelSample)
    graph = distribution.drawPDF()
    mycloud = ot.Cloud(cloudSample)
    graph.add(mycloud)
    graph.setTitle(
        "%.2f%% of the distribution, sample size = %d, " % (100 * alpha, sampleSize)
    )
    return graph
graph = drawLevelSet1D(n, levelSet, alpha, threshold)
view = viewer.View(graph)
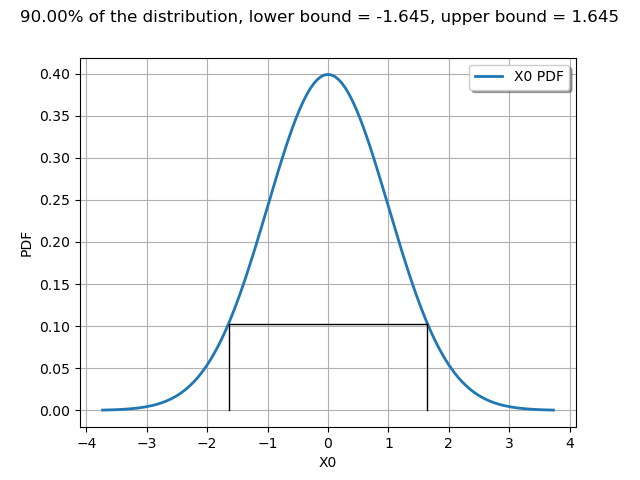
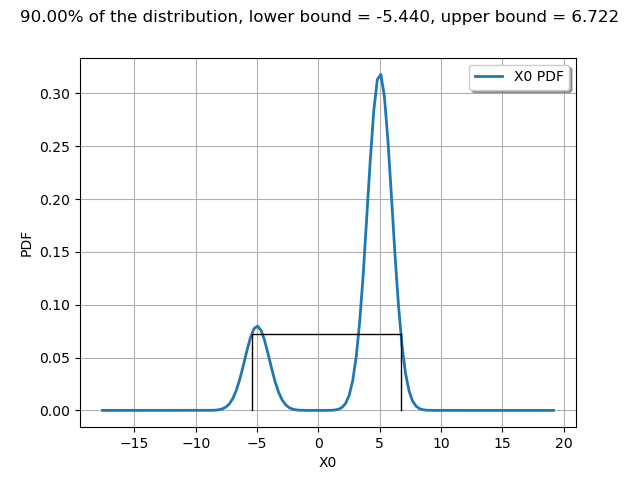
With a Normal, minimum volume Interval
interval = n.computeMinimumVolumeInterval(alpha)
interval
def drawPDFAndInterval1D(distribution, interval, alpha):
    """
    Draw the PDF of the distribution and the lower and upper bounds of an interval.
    """
    xmin = interval.getLowerBound()[0]
    xmax = interval.getUpperBound()[0]
    graph = distribution.drawPDF()
    yvalue = distribution.computePDF(xmin)
    curve = ot.Curve([[xmin, 0.0], [xmin, yvalue], [xmax, yvalue], [xmax, 0.0]])
    curve.setColor("black")
    graph.add(curve)
    graph.setTitle(
        "%.2f%% of the distribution, lower bound = %.3f, upper bound = %.3f"
        % (100 * alpha, xmin, xmax)
    )
    return graph
The computeMinimumVolumeInterval returns an Interval.
graph = drawPDFAndInterval1D(n, interval, alpha)
view = viewer.View(graph)
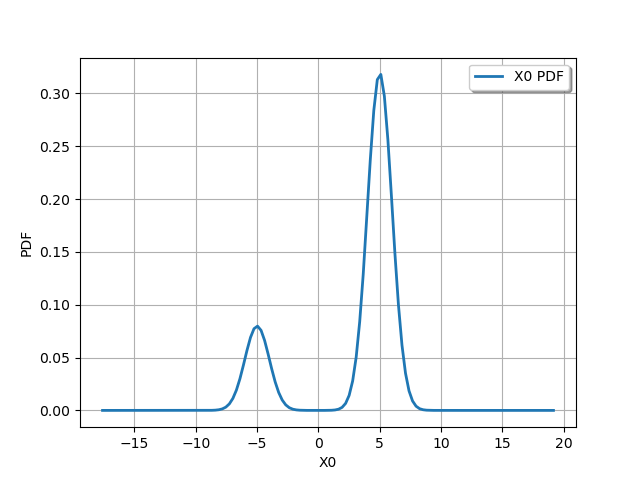
With a Mixture, minimum volume LevelSet
m = ot.Mixture([ot.Normal(-5.0, 1.0), ot.Normal(5.0, 1.0)], [0.2, 0.8])
graph = m.drawPDF()
view = viewer.View(graph)
alpha = 0.9
levelSet, threshold = m.computeMinimumVolumeLevelSetWithThreshold(alpha)
threshold
0.04667473141153258
The interesting point is that a LevelSet may be non-contiguous. In the current mixture example, this is not an interval.
graph = drawLevelSet1D(m, levelSet, alpha, threshold, 1000)
view = viewer.View(graph)
With a Mixture, minimum volume Interval
interval = m.computeMinimumVolumeInterval(alpha)
interval
The computeMinimumVolumeInterval returns an Interval. The bounds of this interval are different from the previous LevelSet.
graph = drawPDFAndInterval1D(m, interval, alpha)
view = viewer.View(graph)
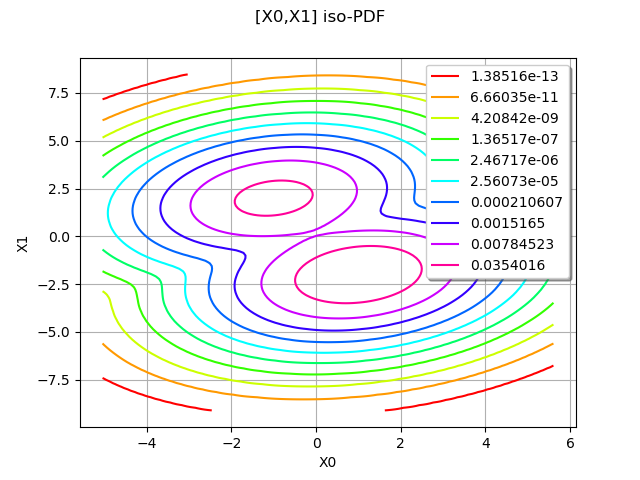
Draw minimum volume level set in 2D
In this paragraph, we compute the minimum volume level set of a bivariate distribution.
Create a Normal distribution
corr = ot.CorrelationMatrix(2)
corr[0, 1] = 0.2
copula = ot.NormalCopula(corr)
x1 = ot.Normal(-1.0, 1)
x2 = ot.Normal(2, 1)
x_funk = ot.JointDistribution([x1, x2], copula)

# Create a second Normal distribution
x1 = ot.Normal(1.0, 1)
x2 = ot.Normal(-2, 1)
x_punk = ot.JointDistribution([x1, x2], copula)

# Mix the distributions
mixture = ot.Mixture([x_funk, x_punk], [0.5, 1.0])
ot.ResourceMap.SetAsString("Contour-DefaultColorMapNorm", "log")
graph = mixture.drawPDF()
view = viewer.View(graph)
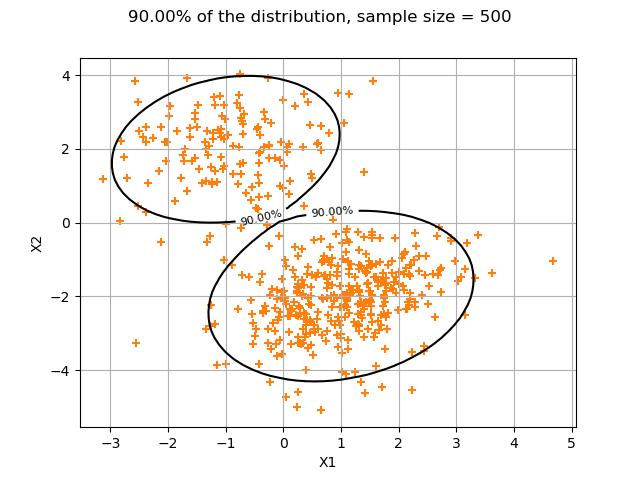
For a multivariate distribution (with dimension greater than 1), the computeMinimumVolumeLevelSetWithThreshold uses Monte-Carlo sampling.
ot.ResourceMap.SetAsUnsignedInteger(
    "Distribution-MinimumVolumeLevelSetSamplingSize", 1000
)
We want to compute the minimum volume LevelSet which contains alpha = 90% of the distribution. The threshold is the value of the PDF corresponding the alpha-probability: the points contained in the LevelSet have a PDF value lower or equal to this threshold.
alpha = 0.9
levelSet, threshold = mixture.computeMinimumVolumeLevelSetWithThreshold(alpha)
threshold
0.00829734011041308
def drawLevelSetContour2D(distribution, alpha, level_set, threshold, sampleSize=500):
    """
    Compute the minimum volume LevelSet of measure equal to alpha and get the
    corresponding density value (named threshold).
    Generate a sample of the distribution and draw it.
    Draw a contour plot for the distribution, where the PDF is equal to threshold.
    """
    sample = distribution.getSample(sampleSize)
    graph = ot.VisualTest.DrawInsideOutside(level_set, sample).getGraph(0, 0)
    labels = ["%.2f%%" % (100 * alpha)]
    contour_graph = distribution.drawPDF(sample.getMin(), sample.getMax())
    contour = contour_graph.getDrawable(0).getImplementation()
    contour.setLevels([threshold])
    contour.setLabels(labels)
    contour.setDrawLabels(True)
    contour.setColor("black")
    graph.setTitle(
        "%.2f%% of the distribution, sample size = %d" % (100 * alpha, sampleSize)
    )
    graph.add(contour)
    return graph, contour
The following plot shows that 90% of the sample is contained in the LevelSet.
graph, contour = drawLevelSetContour2D(mixture, alpha, levelSet, threshold)
view = viewer.View(graph)
plt.show()
Reset default settings
ot.ResourceMap.Reload()