Note
Go to the end to download the full example code.
Create a custom covariance model
This example illustrates how the user can define his own covariance model.
import openturns as ot
import openturns.viewer as viewer
from matplotlib import pylab as plt
import math as m

ot.Log.Show(ot.Log.NONE)
Construct the covariance model
Create the time grid
N = 32
a = 4.0
mesh = ot.IntervalMesher([N]).build(ot.Interval(-a, a))
Create the covariance function depending on (s,t)
def C(s, t):
    return m.exp(-4.0 * abs(s - t) / (1 + (s * s + t * t)))
Create the large covariance matrix
covariance = ot.CovarianceMatrix(mesh.getVerticesNumber())
for k in range(mesh.getVerticesNumber()):
    t = mesh.getVertices()[k]
    for ll in range(k + 1):
        s = mesh.getVertices()[ll]
        covariance[k, ll] = C(s[0], t[0])
Create the covariance model
covmodel = ot.UserDefinedCovarianceModel(mesh, covariance)
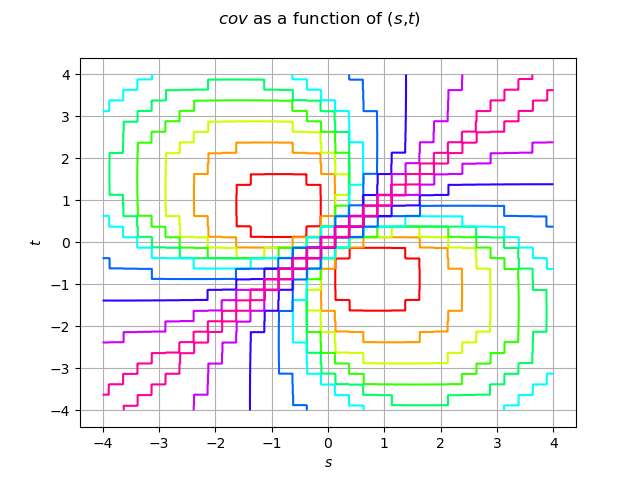
Draw the covariance model as a function
Define the function to draw
def f(x):
    return [covmodel([x[0]], [x[1]])[0, 0]]


func = ot.PythonFunction(2, 1, f)
func.setDescription(["$s$", "$t$", "$cov$"])
Draw the function with default options
cov_graph = func.draw([-a] * 2, [a] * 2, [512] * 2)
cov_graph.setLegendPosition("")
view = viewer.View(cov_graph)
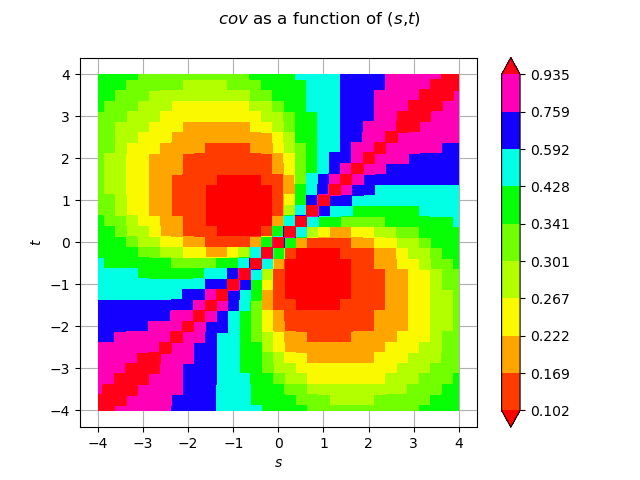
Draw the function in a filled contour graph
cov_graph = func.draw(
    0, 1, 0, [0] * 2, [-a] * 2, [a] * 2, [512] * 2, ot.GraphImplementation.NONE, True
)
view = viewer.View(cov_graph)
Draw the covariance model as a matrix
Use raw matshow
plt.matshow(covariance)
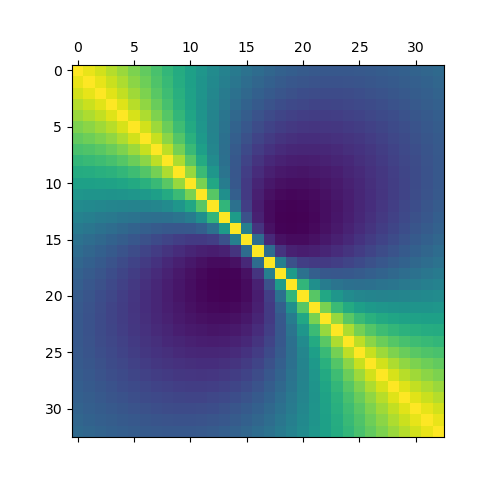
<matplotlib.image.AxesImage object at 0x765a44030e30>
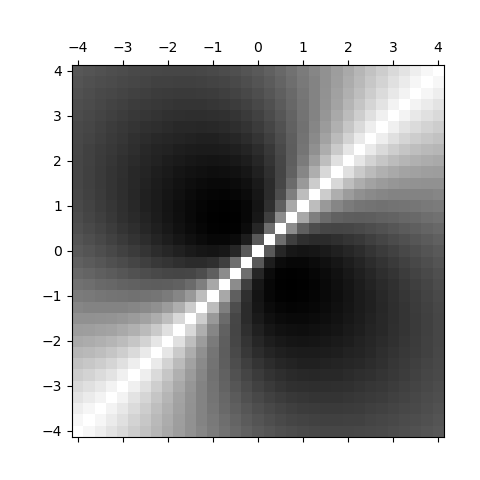
Draw the covariance model as a matrix with the correct axes.
To obtain the correct orientation of the y axis we use the origin argument. To obtain the correct graduations we use the extent argument. We also change the colormap used.
pas = 2 * a / (N - 1)
plt.matshow(
    covariance,
    cmap="gray",
    origin="lower",
    extent=(-a - pas / 2, a + pas / 2, -a - pas / 2, a + pas / 2),
)
plt.show()
Total running time of the script: (0 minutes 4.650 seconds)