Note
Go to the end to download the full example code.
Create a white noise process
This example details how to create and manipulate a white noise.
A second order white noise
 is a stochastic
process of dimension
is a stochastic
process of dimension  such that the covariance function
 where
where  is the covariance matrix of the process at
vertex
is the covariance matrix of the process at
vertex  and
and  the Kroenecker function.
A process  is a white noise if all finite family of
locations
is a white noise if all finite family of
locations  ,
,
 is independent and
identically distributed.
is independent and
identically distributed.
The library proposes to model it through the object WhiteNoise defined
on a mesh and a distribution with zero mean and finite standard
deviation.
If the distribution has a mean different from zero, The library writes message to prevent the User and does not allow the creation of such a white noise.
import openturns as ot
import openturns.viewer as viewer
from matplotlib import pylab as plt

ot.Log.Show(ot.Log.NONE)
Define the distribution
sigma = 1.0
dist = ot.Normal(0.0, sigma)
Define the mesh
tgrid = ot.RegularGrid(0.0, 1.0, 100)
Create the process
process = ot.WhiteNoise(dist, tgrid)
process
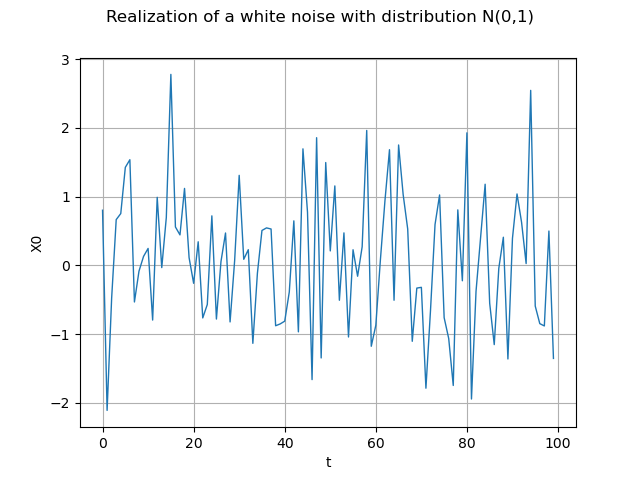
Draw a realization
realization = process.getRealization()
graph = realization.drawMarginal(0)
graph.setTitle("Realization of a white noise with distribution N(0,1)")
view = viewer.View(graph)
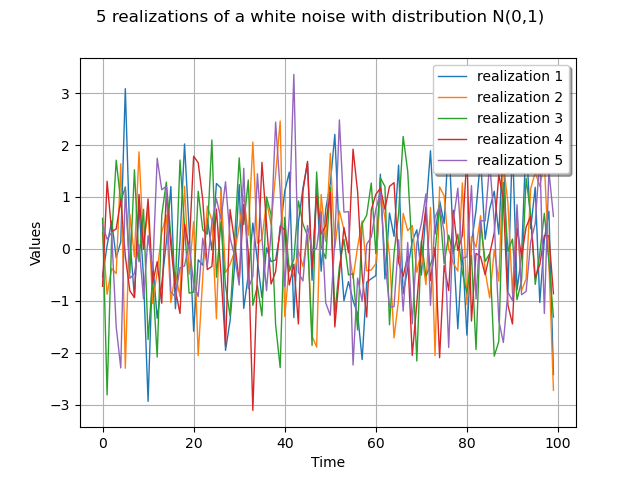
Draw a sample
sample = process.getSample(5)
graph = sample.drawMarginal(0)
graph.setTitle(
    str(sample.getSize()) + " realizations of a white noise with distribution N(0,1)"
)
for k in range(sample.getSize()):
    drawable = graph.getDrawable(k)
    drawable.setLegend("realization " + str(k + 1))
    graph.setDrawable(drawable, k)
view = viewer.View(graph)
plt.show()