Note
Go to the end to download the full example code.
Estimate Sobol’ indices for a function with multivariate output
In this example, we estimate the Sobol’ indices of a function by sampling methods. This function has several outputs, which leads to the need of aggregated Sobol’ indices.
Introduction
In this example we quantify the sensitivity of a function’s outputs to its inputs with Sobol’ indices.
The function we consider has 5 outputs. In this case, it may be convenient to consider each output separately. It may also be interesting to aggregate the sensitivity indices to get a global understanding of the sensitivity of the inputs to the average output.
Define the model
import openturns as ot
import openturns.viewer
import openturns.viewer as viewer

ot.Log.Show(ot.Log.NONE)
We define a linear model with 5 independent Gaussian inputs and 2 outputs.
inputDistribution = ot.Normal(5)
function = ot.SymbolicFunction(
    ["x0", "x1", "x2", "x3", "x4"],
    ["x0 + 4.0 * x1 ^ 2 + 3.0 * x2", "-7.0 * x2 - 4.0 * x3 + x4"],
)
Estimate the Sobol’ indices
We first create a design of experiments with SobolIndicesExperiment.
size = 1000
sie = ot.SobolIndicesExperiment(inputDistribution, size)
inputDesign = sie.generate()
input_names = inputDistribution.getDescription()
inputDesign.setDescription(input_names)
print("Sample size: ", inputDesign.getSize())
Sample size: 7000
We see that 7000 function evaluations are required to estimate the first order and total Sobol’ indices. Then we evaluate the outputs corresponding to this design of experiments.
outputDesign = function(inputDesign)
Then we estimate the Sobol’ indices with the SaltelliSensitivityAlgorithm.
sensitivityAnalysis = ot.SaltelliSensitivityAlgorithm(inputDesign, outputDesign, size)
The getFirstOrderIndices and getTotalOrderIndices method respectively return estimates of first order and total Sobol’ indices with a given output. Since these depend on the output marginal, the index of the output must be specified (the default is to return the index for the first output).
output_dimension = function.getOutputDimension()
for i in range(output_dimension):
    print("Output #", i)
    first_order = sensitivityAnalysis.getFirstOrderIndices(i)
    total_order = sensitivityAnalysis.getTotalOrderIndices(i)
    print("    First order indices: ", first_order)
    print("    Total order indices: ", total_order)

agg_first_order = sensitivityAnalysis.getAggregatedFirstOrderIndices()
agg_total_order = sensitivityAnalysis.getAggregatedTotalOrderIndices()
print("Agg. first order indices: ", agg_first_order)
print("Agg. total order indices: ", agg_total_order)
Output # 0
    First order indices:  [-0.0248738,0.601745,0.132095,-0.0447529,-0.0447529]
    Total order indices:  [0.0172432,0.83259,0.197363,-6.99325e-07,-6.99325e-07]
Output # 1
    First order indices:  [-0.00826858,-0.00826858,0.777015,0.248207,0.0137737]
    Total order indices:  [-1.3404e-06,-1.3404e-06,0.719766,0.281065,0.0121219]
Agg. first order indices:  [-0.0153095,0.25039,0.503556,0.123986,-0.0110427]
Agg. total order indices:  [0.00731069,0.353034,0.498257,0.161887,0.00698166]
We see that:
x1 has a rather large first order index on the first output, but a small index on the second output,
x2 has a rather large first order index on the first output on both outputs,
the largest aggregated Sobol’ index is x2,
x0 and x5 have Sobol’ indices which are close to zero regardless of whether the indices are aggregated or not.
The draw method produces the following graph. The vertical bars represent the 95% confidence intervals of the estimates.
graph = sensitivityAnalysis.draw()
view = viewer.View(graph)
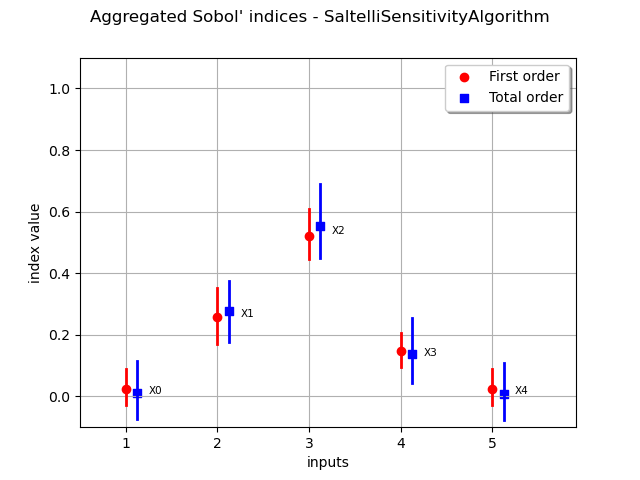
Since there are several outputs, the graph presents the aggregated Sobol’ indices. The aggregated Sobol’ indices indicate that the input variable which has the largest impact on the variability of the several outputs is x2.