Note
Go to the end to download the full example code.
Example on 2-d data
import openturns as ot
import otsliced
import matplotlib.pyplot as plt
Create 2-d data X and 1-d feature Y
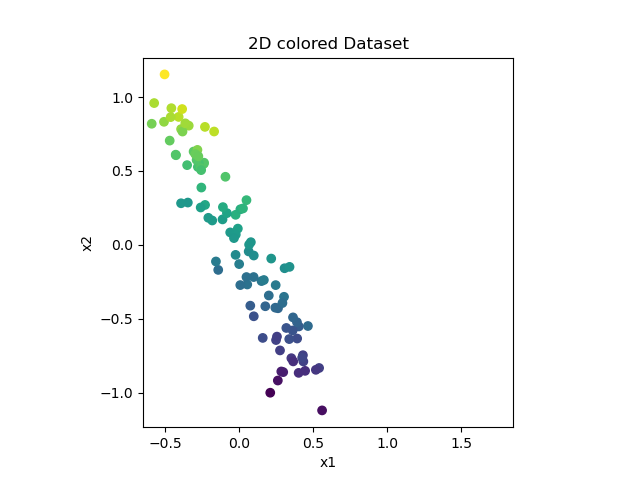
Plot data
plt.scatter(X.getMarginal(0), X.getMarginal(1), c=Y)
plt.xlabel('x1')
plt.ylabel('x2')
plt.axis('square')
plt.title("2D colored Dataset")

Text(0.5, 1.0, '2D colored Dataset')
Run the SIR algorithm
algo = otsliced.SlicedInverseRegression(X, Y)
algo.run()
transformation = algo.getResult().getTransformation()
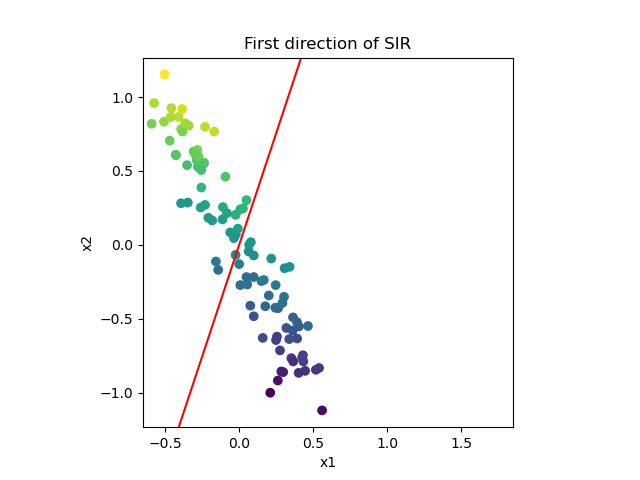
Show SIR direction
plt.scatter(X.getMarginal(0), X.getMarginal(1), c=Y)
plt.xlabel('x1')
plt.ylabel('x2')
plt.axis('square')
plt.title("First direction of SIR")
dir_sir = algo.getResult().getDirections()
plt.plot([-dir_sir[0, 0] * 30, dir_sir[0, 0] * 30], [-dir_sir[1, 0] * 30, dir_sir[1, 0] * 30], c='red')

[<matplotlib.lines.Line2D object at 0x7f1d0c6c73b0>]
plt.show()
Total running time of the script: (0 minutes 0.126 seconds)