Estimate a non stationary covariance function
The objective of this use case is to estimate  from several fields generated by the process
  . We suppose that the process is not stationary.
In the following example, we illustrate the estimation of the non stationary covariance model ![C : \mathcal{D} \times [-4, 4] \rightarrow \mathbb{R}](../../_images/math/57cda78cb1d746c397331bb67cdd98bdcb715b99.svg) defined by:
defined by:

The domain  is discretized on a mesh
  which is a time grid with 64 points. We build a normal process
 ![X: \Omega \times [-4, 4] \rightarrow \mathbb{R}](../../_images/math/09b6d38af272ddaded885015b2e65b210d9fb2a5.svg) with zero mean and as covariance function. We discretize the covariance model using
with zero mean and as covariance function. We discretize the covariance model using  for each
  . We get a
  fields from the process from wich we estimate the covariance model .
We use the object NonStationaryCovarianceModelFactory which creates a UserDefinedCovarianceModel.
[1]:
from __future__ import print_function
import math as m
import openturns as ot
[2]:
# Create the time grid
t0 = -4.0
tmax = 4.0
N = 64
dt = (tmax - t0) / N
tgrid = ot.RegularGrid(t0, dt, N)
[3]:
# Create the covariance function at (s,t)
def C(s, t):
    return m.exp(-4.0 * abs(s - t) / (1 + (s * s + t * t)))
[4]:
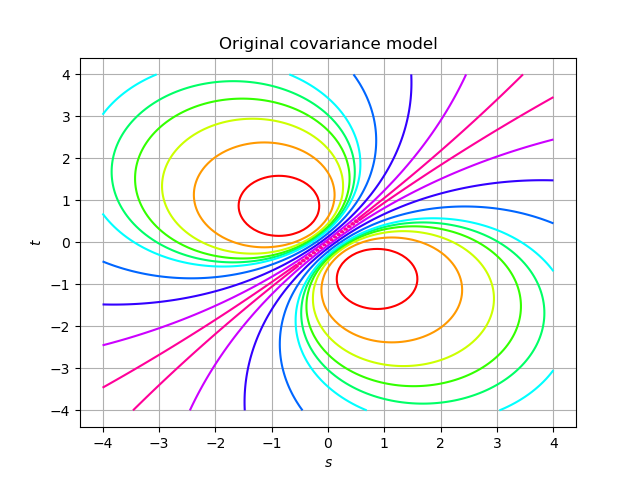
# Draw...
def f(X):
    s, t = X
    return [C(s, t)]

func = ot.PythonFunction(2, 1, f)
func.setDescription(['$s$', '$t$', '$cov$'])
graph = func.draw([t0] * 2, [tmax] * 2)
graph.setTitle('Original covariance model')
graph.setLegendPosition('')
graph
[4]:
[5]:
# Create data from a non stationary normal process Omega * [0,T]--> R

# Create the collection of HermitianMatrix
covariance = ot.CovarianceMatrix(N)
for k in range(N):
    s = tgrid.getValue(k)
    for l in range(k + 1):
        t = tgrid.getValue(l)
        covariance[k, l] = C(s, t)

covmodel = ot.UserDefinedCovarianceModel(tgrid, covariance)
[6]:
# Create the normal process with that covariance model
# based on the mesh tgrid
process = ot.GaussianProcess(covmodel, tgrid)

# Get a sample of fields from the process
N = 1000
sample = process.getSample(N)
[7]:
# The covariance model factory
factory = ot.NonStationaryCovarianceModelFactory()

# Estimation on a sample
estimatedModel = factory.build(sample)
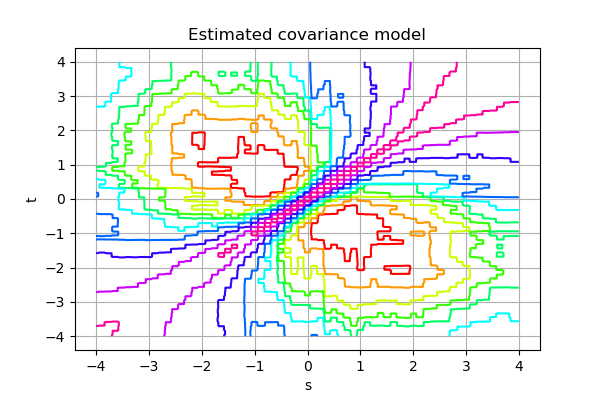
[8]:
graph = estimatedModel.draw(0, 0, t0, tmax, 256, False)
graph.setTitle('Estimated covariance model')
graph.setLegendPosition('')
graph
[8]: