Uncertainty ranking: Pearson’s correlation
This method deals with analyzing the influence the random vector
 has on a random
variable
has on a random
variable  which is being studied for uncertainty. Here we
attempt to measure linear relationships that exist between
and the different components
which is being studied for uncertainty. Here we
attempt to measure linear relationships that exist between
and the different components  .
.
Pearson’s correlation coefficient  , defined in ,
measures the strength of a linear relation between two random variables
and . If we have a sample made up of
, defined in ,
measures the strength of a linear relation between two random variables
and . If we have a sample made up of  pairs
pairs  ,
,  , …,
, …,
 , we can obtain
  an
estimation of Pearson’s coefficient. The hierarchical ordering of
Pearson’s coefficients is of interest in the case where the relationship
between and
an
estimation of Pearson’s coefficient. The hierarchical ordering of
Pearson’s coefficients is of interest in the case where the relationship
between and  variables
 is close to being a linear
relation:
is close to being a linear
relation:

To obtain an indication of the role played by each in the
dispersion of , the idea is to estimate Pearson’s correlation
coefficient  for each
  . One can
then order the variables
. One can
then order the variables  taking
absolute values of the correlation coefficients: the higher the value of
taking
absolute values of the correlation coefficients: the higher the value of
 the greater the impact
the variable has on the dispersion of .
the greater the impact
the variable has on the dispersion of .
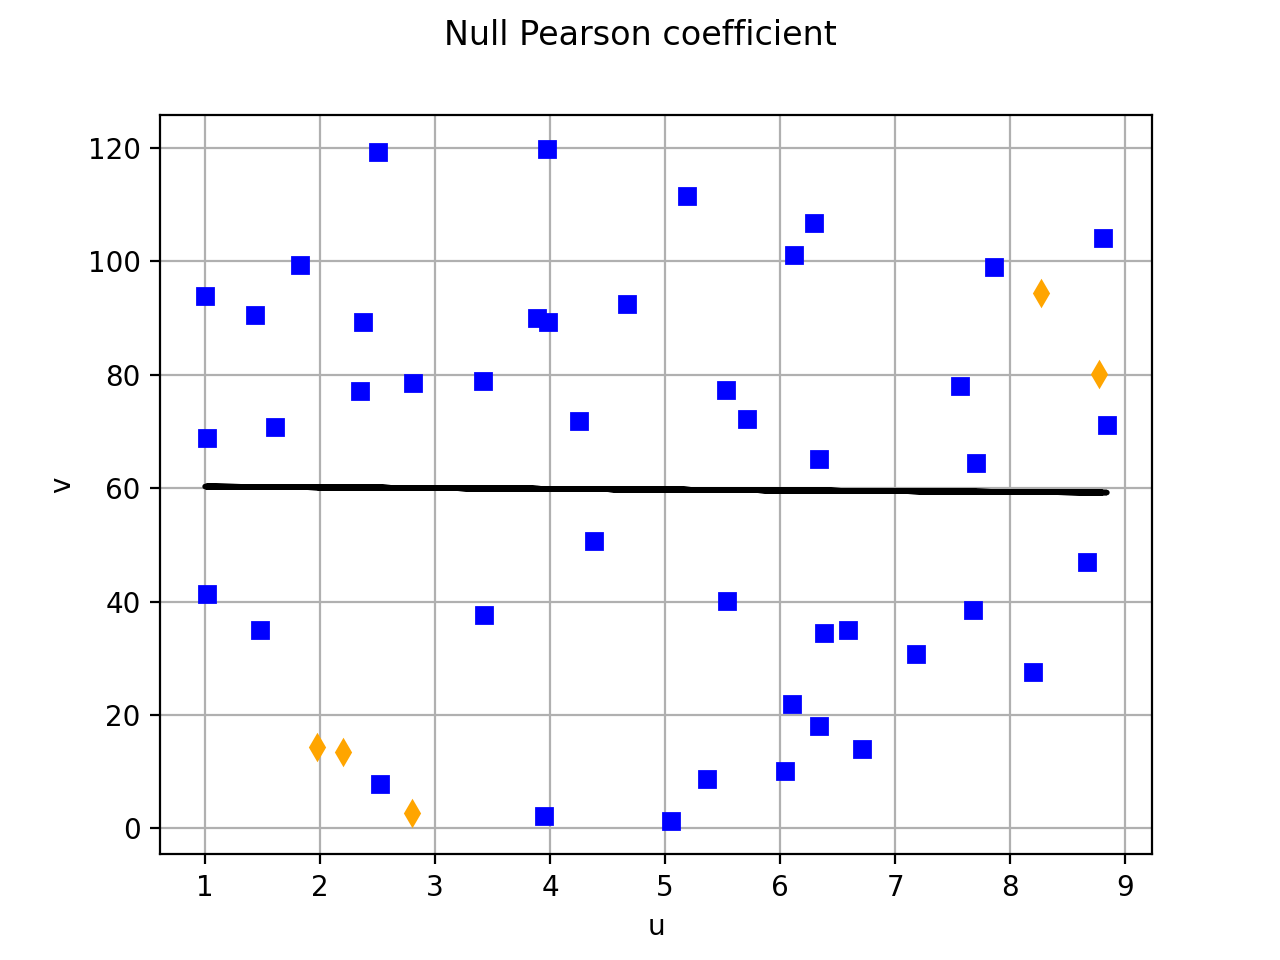
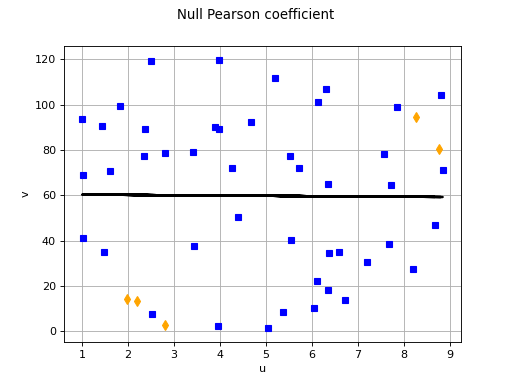
(Source code, png, hires.png, pdf)
API:
Examples:
References:
Saltelli, A., Chan, K., Scott, M. (2000). “Sensitivity Analysis”, John Wiley & Sons publishers, Probability and Statistics series
J.C. Helton, F.J. Davis (2003). “Latin Hypercube sampling and the propagation of uncertainty analyses of complex systems”. Reliability Engineering and System Safety 81, p.23-69
J.P.C. Kleijnen, J.C. Helton (1999). “Statistical analyses of scatterplots to identify factors in large-scale simulations, part 1 : review and comparison of techniques”. Reliability Engineering and System Safety 65, p.147-185