Note
Click here to download the full example code
Fit a parametric distribution
In this example we estimate the parameters of a distribution from a given sample. Once we are settled on a good candidate, we use the corresponding factory to fit the distribution. Each distribution factory has one or several estimators available. They are all derived from either the Maximum Likelihood method or from the method of moments (see Parametric Estimation).
from __future__ import print_function
import openturns as ot
import openturns.viewer as viewer
from matplotlib import pylab as plt
ot.Log.Show(ot.Log.NONE)
The Normal distribution
The parameters are estimated by the method of moments.
We consider a sample, here created from a standard normal distribution :
sample = ot.Normal().getSample(1000)
We can estimate a normal distribution with ǸormalFactory :
distribution = ot.NormalFactory().build(sample)
We take a look at the estimated parameters with the getParameter method :
print(distribution.getParameter())
Out:
[0.00320214,1.02733]
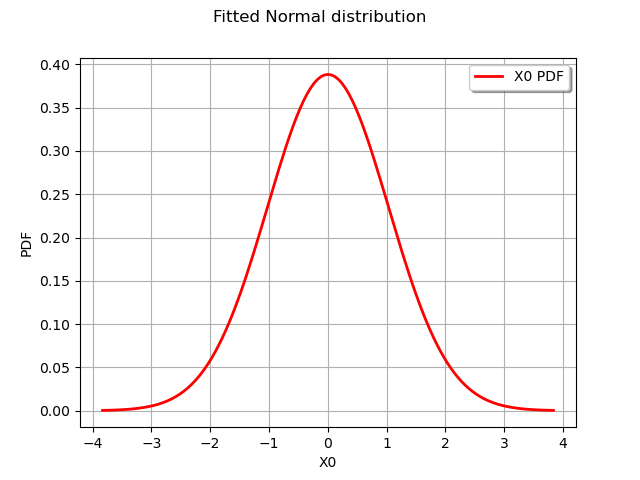
We draw the fitted distribution
graph = distribution.drawPDF()
graph.setTitle("Fitted Normal distribution")
view = viewer.View(graph)
The Student distribution
The parameters of the Student law are estimated by a mixed method of moments and reduces MLE.
We generate a sample from a Student distribution with parameters  ,
,  and a scale parameter
  .
.
sample = ot.Student(5.0, -0.5, 2.0).getSample(1000)
We use the factory to build an estimated distribution :
distribution = ot.StudentFactory().build(sample)
We can obtain the estimated parameters with the getParameter method :
print(distribution.getParameter())
Out:
[3.65576,-0.515215,1.84614]
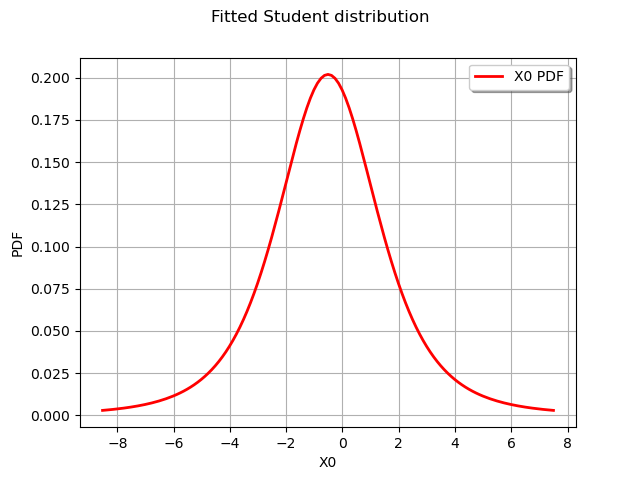
Draw fitted distribution
graph = distribution.drawPDF()
graph.setTitle("Fitted Student distribution")
view = viewer.View(graph)
The Pareto distribution
By default the parameters of the Pareto distribution are estimated by least squares.
We use a sample from a Pareto distribution with a scale parameter  , a shape parameter
  and a location parameter
  .
.
sample = ot.Pareto(1.0, 1.0, 0.0).getSample(1000)
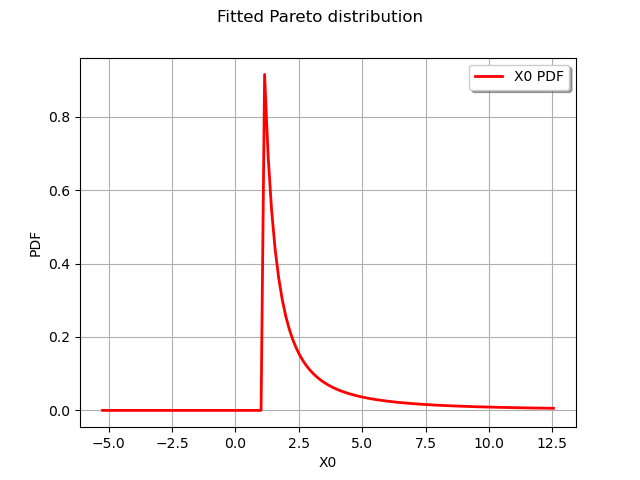
Draw fitted distribution
distribution = ot.ParetoFactory().build(sample)

print(distribution.getParameter())

graph = distribution.drawPDF()
graph.setTitle("Fitted Pareto distribution")
view = viewer.View(graph)


plt.show()
Out:
[0.787856,0.944192,0.246677]
Total running time of the script: ( 0 minutes 0.328 seconds)