Note
Click here to download the full example code
Copula fitting test using Kendall plot
In this example we are going to perform a visual goodness-of-fit test for a copula with the Kendall plot test.
from __future__ import print_function
import openturns as ot
import openturns.viewer as viewer
from matplotlib import pylab as plt
ot.Log.Show(ot.Log.NONE)
Create two samples
N = 500

dist1 = ot.ComposedDistribution([ot.Normal()] * 2, ot.GumbelCopula(3.0))
sample1 = dist1.getSample(N)
sample1.setName('sample1')

dist2 = ot.ComposedDistribution([ot.Normal()] * 2, ot.ClaytonCopula(0.2))
sample2 = dist2.getSample(N)
sample2.setName('sample2')
Change the parameter for the evaluation of E(Wi)
ot.ResourceMap.SetAsUnsignedInteger('VisualTest-KendallPlot-MonteCarloSize', 25)
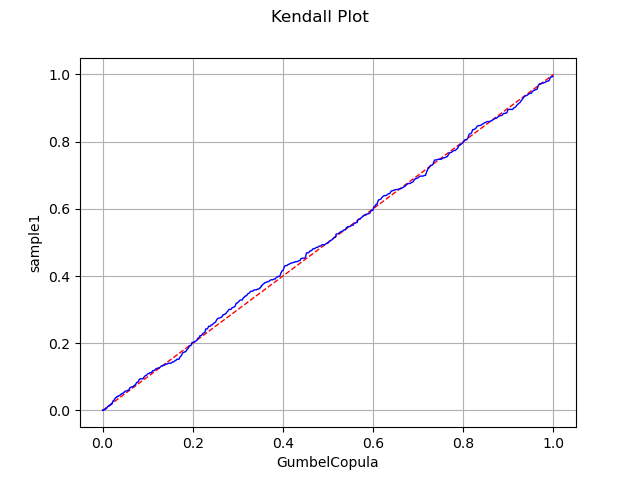
Test a specific copula model for a given sample
copula_test = ot.GumbelCopula(3)
graph = ot.VisualTest.DrawKendallPlot(sample1, copula_test)
view =viewer.View(graph)
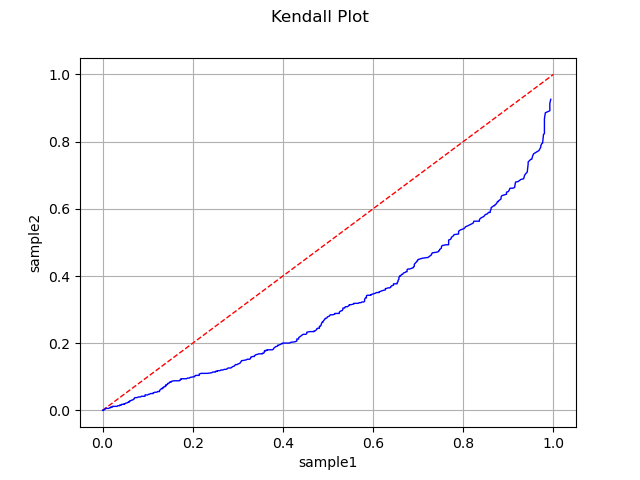
Test whether two samples have the same copula model
graph = ot.VisualTest.DrawKendallPlot(sample1, sample2)
view = viewer.View(graph)
plt.show()
Total running time of the script: ( 0 minutes 0.478 seconds)