Note
Click here to download the full example code
Draw 1-d distribution graphs
In this example we are going to draw PDF and CDF of an unidimensional distribution.
from __future__ import print_function
import openturns as ot
import openturns.viewer as viewer
from matplotlib import pylab as plt
ot.Log.Show(ot.Log.NONE)

# assume an 1-d distribution
distribution = ot.Gumbel(0.45, 0.6)
print(distribution)
Out:
Gumbel(beta = 0.45, gamma = 0.6)
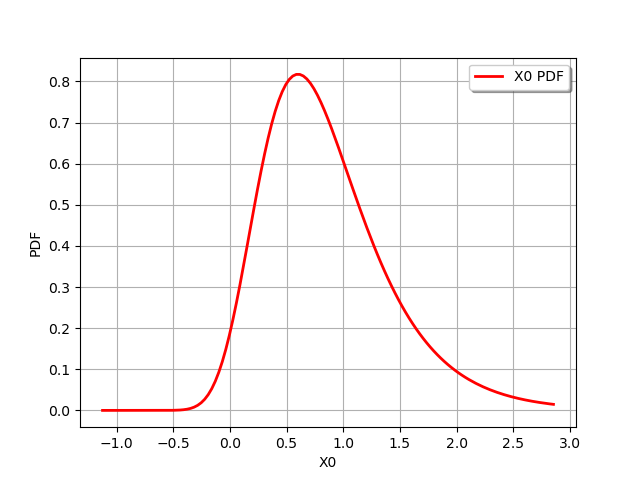
draw PDF
graph = distribution.drawPDF()
# IMPORTANT: note that this command just generates the graph data
# and is only drawn in the context of Jupyter notebooks.
# To plot from a script, see the viewer module.
view = viewer.View(graph)
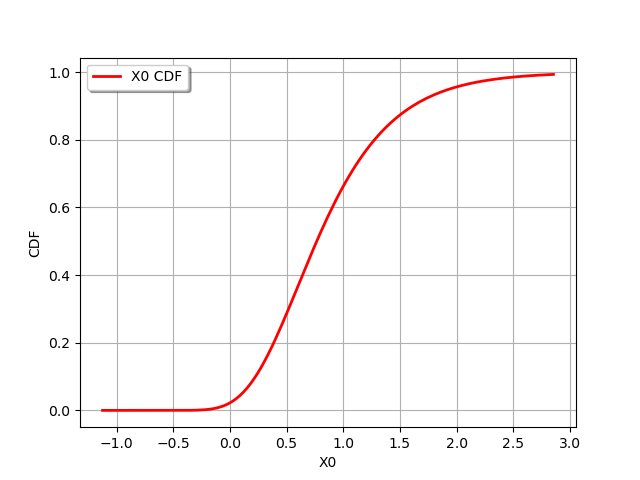
draw CDF
graph = distribution.drawCDF()
view = viewer.View(graph)
plt.show()
Total running time of the script: ( 0 minutes 0.157 seconds)