Note
Click here to download the full example code
Draw minimum volume level set in 1D
In this example, we compute the minimum volume level set of a univariate distribution.
import openturns as ot
import openturns.viewer as viewer
from matplotlib import pylab as plt
ot.Log.Show(ot.Log.NONE)
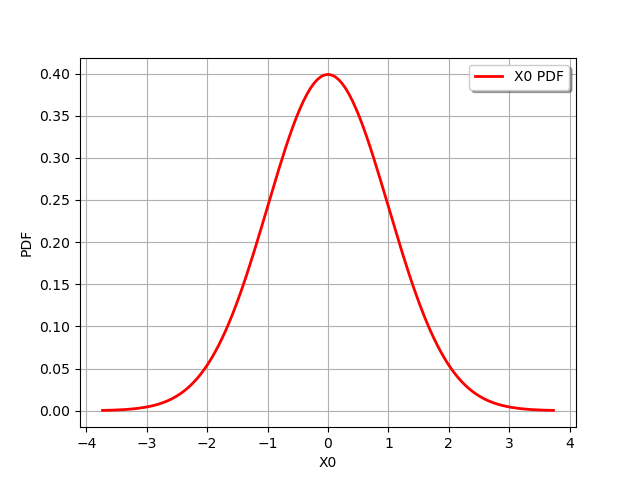
With a Normal, minimum volume LevelSet
n = ot.Normal()
graph = n.drawPDF()
view = viewer.View(graph)
We want to compute the minimum volume LevelSet which contains alpha`=90% of the distribution. The `threshold is the value of the PDF corresponding the alpha-probability: the points contained in the LevelSet have a PDF value lower or equal to this threshold.
alpha = 0.9
levelSet, threshold = n.computeMinimumVolumeLevelSetWithThreshold(alpha)
threshold
Out:
0.1031356403794346
The LevelSet has a contains method. Obviously, the point 0 is in the LevelSet.
levelSet.contains([0.])
Out:
True
def computeSampleInLevelSet(distribution, levelSet, sampleSize = 1000):
    '''
    Generate a sample from given distribution.
    Extract the sub-sample which is contained in the levelSet.
    '''
    sample = distribution.getSample(sampleSize)
    dim = distribution.getDimension()
    # Get the list of points in the LevelSet.
    inLevelSet = []
    for x in sample:
        if levelSet.contains(x):
            inLevelSet.append(x)
    # Extract the sub-sample of the points in the LevelSet
    numberOfPointsInLevelSet = len(inLevelSet)
    inLevelSetSample = ot.Sample(numberOfPointsInLevelSet,dim)
    for i in range(numberOfPointsInLevelSet):
        inLevelSetSample[i] = inLevelSet[i]
    return inLevelSetSample
def from1Dto2Dsample(oldSample):
    '''
    Create a 2D sample from a 1D sample with zero ordinate (for the graph).
    '''
    size = oldSample.getSize()
    newSample = ot.Sample(size,2)
    for i in range(size):
        newSample[i,0] = oldSample[i,0]
    return newSample
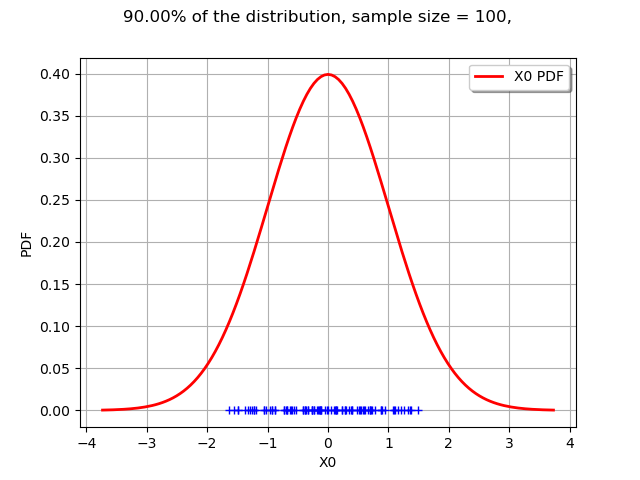
def drawLevelSet1D(distribution, levelSet, alpha, threshold, sampleSize = 100):
    '''
    Draw a 1D sample included in a given levelSet.
    The sample is generated from the distribution.
    '''
    inLevelSample = computeSampleInLevelSet(distribution,levelSet,sampleSize)
    cloudSample = from1Dto2Dsample(inLevelSample)
    graph = distribution.drawPDF()
    mycloud = ot.Cloud(cloudSample)
    graph.add(mycloud)
    graph.setTitle("%.2f%% of the distribution, sample size = %d, " % (100*alpha, sampleSize))
    return graph
graph = drawLevelSet1D(n, levelSet, alpha, threshold)
view = viewer.View(graph)
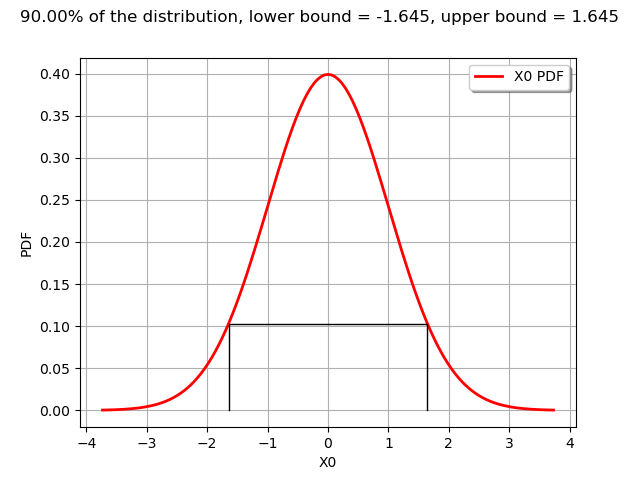
With a Normal, minimum volume Interval
interval = n.computeMinimumVolumeInterval(alpha)
interval
[-1.64485, 1.64485]
def drawPDFAndInterval1D(distribution, interval, alpha):
    '''
    Draw the PDF of the distribution and the lower and upper bounds of an interval.
    '''
    xmin = interval.getLowerBound()[0]
    xmax = interval.getUpperBound()[0]
    graph = distribution.drawPDF()
    yvalue = distribution.computePDF(xmin)
    curve = ot.Curve([[xmin,0.],[xmin,yvalue],[xmax,yvalue],[xmax,0.]])
    curve.setColor("black")
    graph.add(curve)
    graph.setTitle("%.2f%% of the distribution, lower bound = %.3f, upper bound = %.3f" % (100*alpha, xmin,xmax))
    return graph
The computeMinimumVolumeInterval returns an Interval.
graph = drawPDFAndInterval1D(n, interval, alpha)
view = viewer.View(graph)
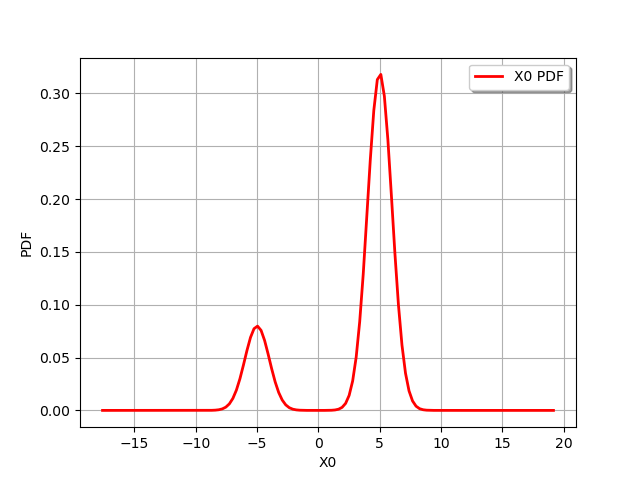
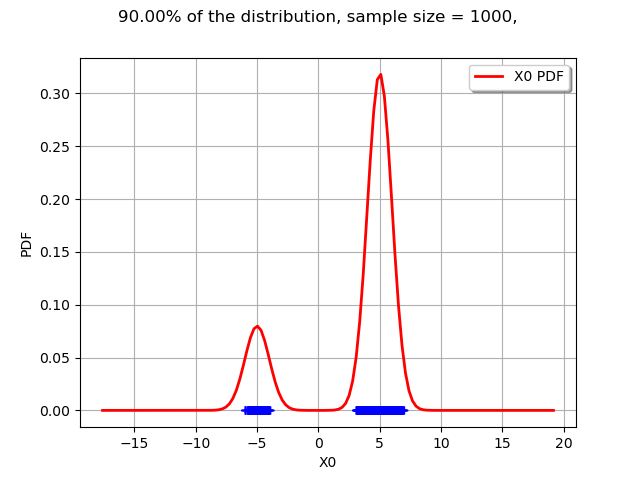
With a Mixture, minimum volume LevelSet
m = ot.Mixture([ot.Normal(-5.,1.),ot.Normal(5.,1.)],[0.2,0.8])
graph = m.drawPDF()
view = viewer.View(graph)
alpha = 0.9
levelSet, threshold = m.computeMinimumVolumeLevelSetWithThreshold(alpha)
threshold
Out:
0.04667473141178892
The interesting point is that a LevelSet may be non-contiguous. In the current mixture example, this is not an interval.
graph = drawLevelSet1D(m, levelSet, alpha, threshold, 1000)
view = viewer.View(graph)
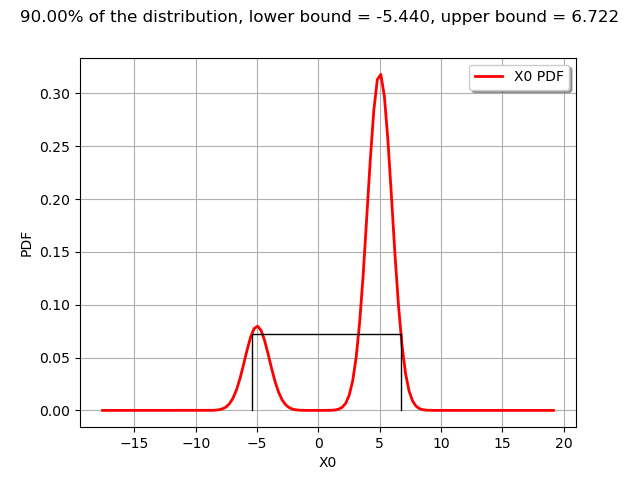
With a Mixture, minimum volume Interval
interval = m.computeMinimumVolumeInterval(alpha)
interval
[-5.44003, 6.72227]
The computeMinimumVolumeInterval returns an Interval. The bounds of this interval are different from the previous LevelSet.
graph = drawPDFAndInterval1D(m, interval, alpha)
view = viewer.View(graph)
plt.show()
Total running time of the script: ( 0 minutes 0.502 seconds)