Note
Click here to download the full example code
Create a discrete Markov chain process
This example details first how to create and manipulate a discrete Markov chain.
A discrete Markov chain  , where
 ![E = [\![ 0,...,p-1]\!]](../../_images/math/6b7cbb4a7b815f9c424c192fe7f001a1add95d84.svg) is a process
where
is a process
where  discretized on the time grid
  such
that:
such
that:

The transition matrix of the process  can be defined such that:

The library proposes to model it through the object DiscreteMarkovChain defined thanks to the origin  (which can be either deterministic or uncertain), the transition matrix
  and the time grid.
from __future__ import print_function
import openturns as ot
import openturns.viewer as viewer
from matplotlib import pylab as plt
ot.Log.Show(ot.Log.NONE)
Define the origin
origin = ot.Dirac(0.0)
Define the transition matrix
transition = ot.SquareMatrix([[0.1, 0.3, 0.6], [0.7, 0.1, 0.2], [0.5, 0.3, 0.2]])
Define an 1-d mesh
tgrid = ot.RegularGrid(0.0, 1.0, 50)
Markov chain definition and realization
process = ot.DiscreteMarkovChain(origin, transition, tgrid)
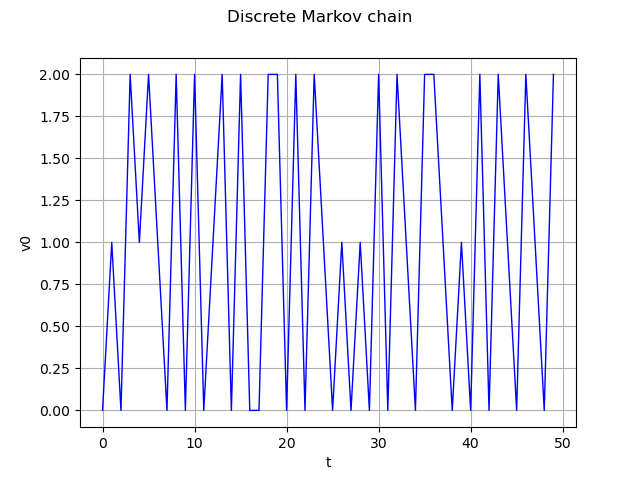
real = process.getRealization()
graph = real.drawMarginal(0)
graph.setTitle('Discrete Markov chain')
view = viewer.View(graph)
Get several realizations
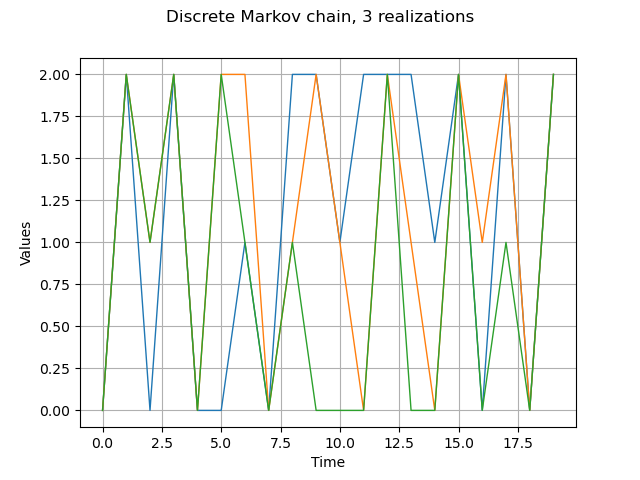
process.setTimeGrid(ot.RegularGrid(0.0,1.0,20))
reals = process.getSample(3)
graph = reals.drawMarginal(0)
graph.setTitle('Discrete Markov chain, 3 realizations')
view = viewer.View(graph)
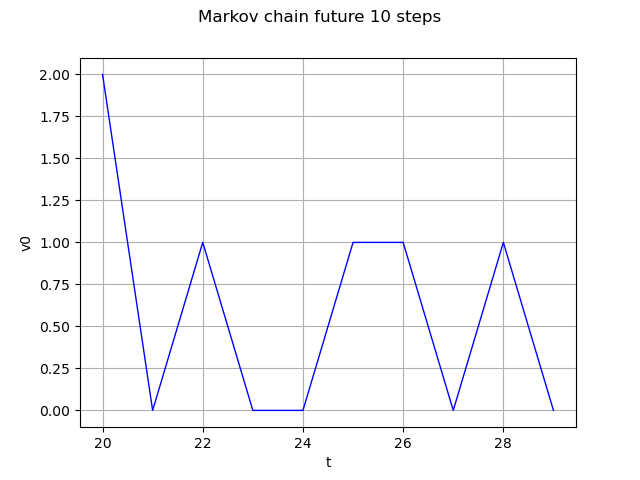
Markov chain future 10 steps
future = process.getFuture(10)
graph = future.drawMarginal(0)
graph.setTitle('Markov chain future 10 steps')
view = viewer.View(graph)
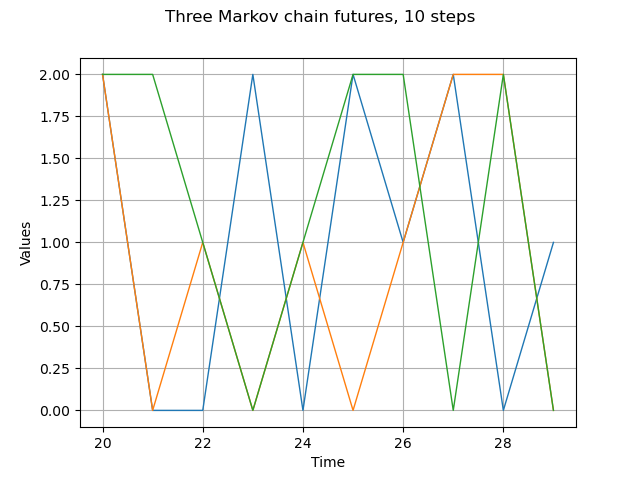
Markov chain 3 different futures
futures = process.getFuture(10,3)
graph = futures.drawMarginal(0)
graph.setTitle('Three Markov chain futures, 10 steps')
view = viewer.View(graph)
plt.show()
Total running time of the script: ( 0 minutes 0.312 seconds)