Note
Click here to download the full example code
Create a random walk process
This example details first how to create and manipulate a random walk.
A random walk  is a process
where
is a process
where  discretized on the time grid
  such
that:
such
that:

where  and
and  is a white noise of
dimension
is a white noise of
dimension  .
.
The library proposes to model it through the object RandomWalk defined thanks to the origin, the distribution of the white noise and the time grid.
from __future__ import print_function
import openturns as ot
import openturns.viewer as viewer
from matplotlib import pylab as plt
import math as m
ot.Log.Show(ot.Log.NONE)
Define the origin
origin = [0.0]
Define an 1-d mesh
tgrid = ot.RegularGrid(0.0, 1.0, 500)
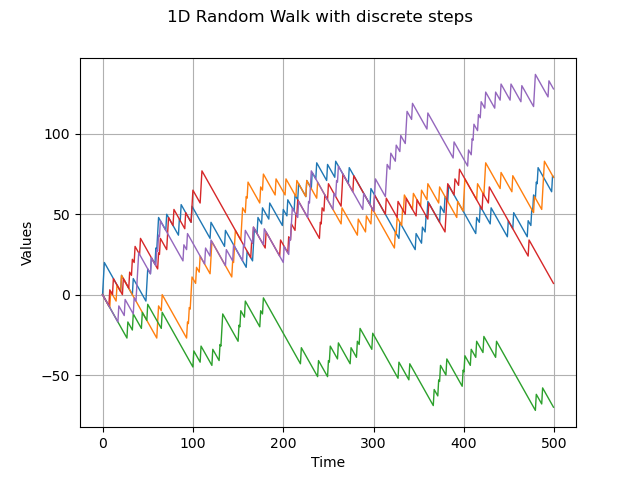
1-d random walk and discrete distribution
dist = ot.UserDefined([[-1], [10]],[0.9, 0.1] )
process = ot.RandomWalk(origin, dist, tgrid)
sample = process.getSample(5)
graph = sample.drawMarginal(0)
graph.setTitle('1D Random Walk with discrete steps')
view = viewer.View(graph)
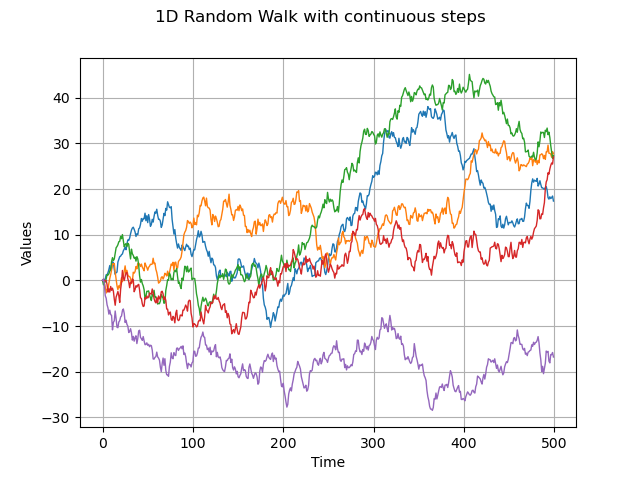
1-d random walk and continuous distribution
dist = ot.Normal(0.0, 1.0)
process = ot.RandomWalk(origin, dist, tgrid)
sample = process.getSample(5)
graph = sample.drawMarginal(0)
graph.setTitle('1D Random Walk with continuous steps')
view = viewer.View(graph)
Define the origin
origin = [0.0]*2
color palette
pal = ['red', 'cyan', 'blue', 'yellow', 'green']
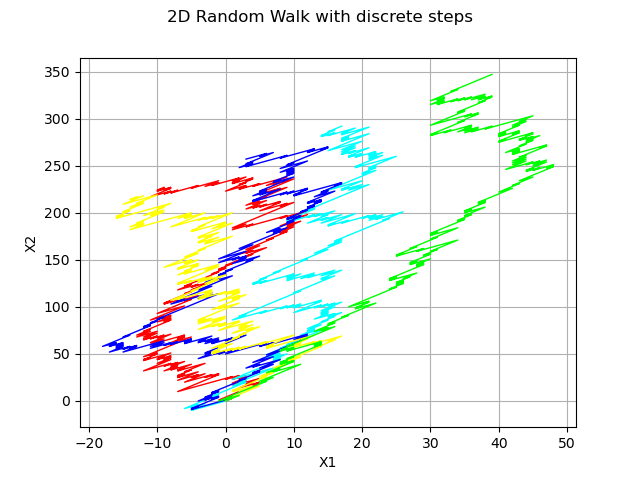
2-d random walk and discrete distribution
dist = ot.UserDefined([[-1., -2.], [1., 3.]], [0.5, 0.5])
process = ot.RandomWalk(origin, dist, tgrid)
sample = process.getSample(5)
graph = ot.Graph('2D Random Walk with discrete steps', 'X1', 'X2', True)
for i in range(5) :
    graph.add(ot.Curve(sample[i], pal[i % len(pal)], 'solid'))
view = viewer.View(graph)
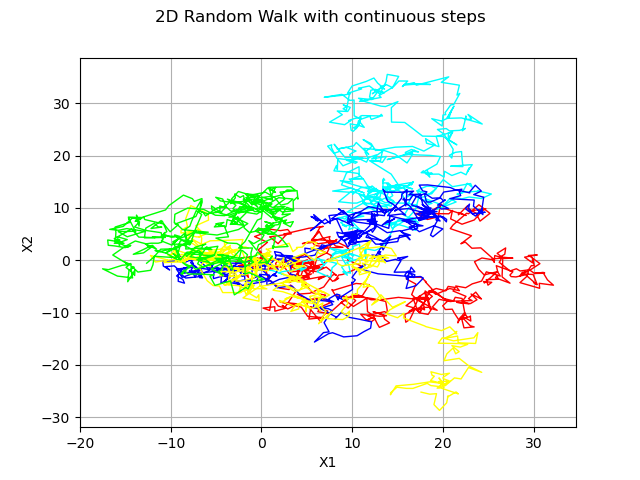
2-d random walk and continuous distribution
dist = ot.Normal(2)
process = ot.RandomWalk(origin, dist, tgrid)
sample = process.getSample(5)
graph = ot.Graph('2D Random Walk with continuous steps', 'X1', 'X2', True)
for i in range(5) :
    graph.add(ot.Curve(sample[i], pal[i % len(pal)], 'solid'))
view = viewer.View(graph)
plt.show()
Total running time of the script: ( 0 minutes 0.339 seconds)