Note
Click here to download the full example code
Exploitation of simulation algorithm results
In this example we are going to retrieve all the results proposed by probability simulation algorithms:
the probability estimate
the estimator variance
the confidence interval
the convergence graph of the estimator
the stored input and output numerical samples
importance factors
from __future__ import print_function
import openturns as ot
import openturns.viewer as viewer
from matplotlib import pylab as plt
ot.Log.Show(ot.Log.NONE)
Create the joint distribution of the parameters.
distribution_R = ot.LogNormalMuSigma(300.0, 30.0, 0.0).getDistribution()
distribution_F = ot.Normal(75e3, 5e3)
marginals = [distribution_R, distribution_F]
distribution = ot.ComposedDistribution(marginals)
Create the model.
model = ot.SymbolicFunction(['R', 'F'], ['R-F/(pi_*100.0)'])
modelCallNumberBefore = model.getEvaluationCallsNumber()
modelGradientCallNumberBefore = model.getGradientCallsNumber()
modelHessianCallNumberBefore = model.getHessianCallsNumber()
To have access to the input and output samples after the simulation, activate the History mechanism.
model = ot.MemoizeFunction(model)
Remove all the values stored in the history mechanism. Care : it is done regardless the status of the History mechanism.
model.clearHistory()
Create the event whose probability we want to estimate.
vect = ot.RandomVector(distribution)
G = ot.CompositeRandomVector(model, vect)
event = ot.ThresholdEvent(G, ot.Less(), 0.0)
Create a Monte Carlo algorithm.
experiment = ot.MonteCarloExperiment()
algo = ot.ProbabilitySimulationAlgorithm(event, experiment)
algo.setMaximumCoefficientOfVariation(0.1)
algo.setMaximumStandardDeviation(0.001)
algo.setMaximumOuterSampling(int(1e4))
Define the HistoryStrategy to store the values of  and
and  used ot draw the convergence graph.
Compact strategy : N points
used ot draw the convergence graph.
Compact strategy : N points
N = 1000
algo.setConvergenceStrategy(ot.Compact(N))
algo.run()
Retrieve result structure.
result = algo.getResult()
Display the simulation event probability.
result.getProbabilityEstimate()
Out:
0.02892561983471075
Criteria 3 : Display the Standard Deviation of the estimator
result.getStandardDeviation()
Out:
0.0028793594509308627
Display the variance of the simulation probability estimator.
result.getVarianceEstimate()
Out:
8.290710847664879e-06
Criteria 2 : Display the number of iterations of the simulation
result.getOuterSampling()
Out:
3388
Display the total number of evaluations of the model
result.getOuterSampling() * result.getBlockSize()
Out:
3388
Save the number of calls to the model, its gradient and hessian done so far.
modelCallNumberAfter = model.getEvaluationCallsNumber()
modelGradientCallNumberAfter = model.getGradientCallsNumber()
modelHessianCallNumberAfter = model.getHessianCallsNumber()
Display the number of iterations executed and the number of evaluations of the model.
modelCallNumberAfter - modelCallNumberBefore
Out:
3388
Get the mean point in event domain care : only for Monte Carlo and LHS sampling methods.
result.getMeanPointInEventDomain()
[245.234,80683.9]
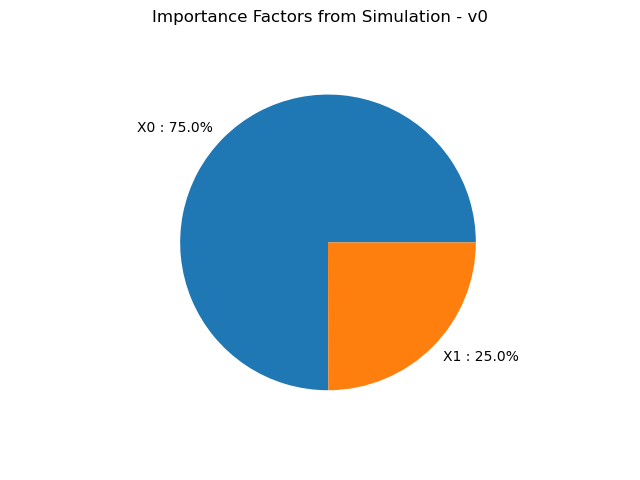
Get the associated importance factors care : only for Monte Carlo and LHS sampling methods.
result.getImportanceFactors()
[X0 : 0.750364, X1 : 0.249636]
graph = result.drawImportanceFactors()
view = viewer.View(graph)
Display the confidence interval length centered around the MonteCarlo probability. The confidence interval is
![IC = [\tilde{p} - 0.5 \ell, \tilde{p} + 0.5 \ell]](../../_images/math/f8d558c623e24066bb579238bc9478e826d19c70.svg)
with level 0.95, where  is the estimated probability and
  is the confidence interval length.
probability = result.getProbabilityEstimate()
length95 = result.getConfidenceLength(0.95)
print("0.95 Confidence Interval length = ", length95)
print("IC at 0.95 = [", probability - 0.5*length95, "; ", probability + 0.5*length95, "]")
Out:
0.95 Confidence Interval length =  0.01128688164473903
IC at 0.95 = [ 0.023282179012341236 ;  0.034569060657080264 ]
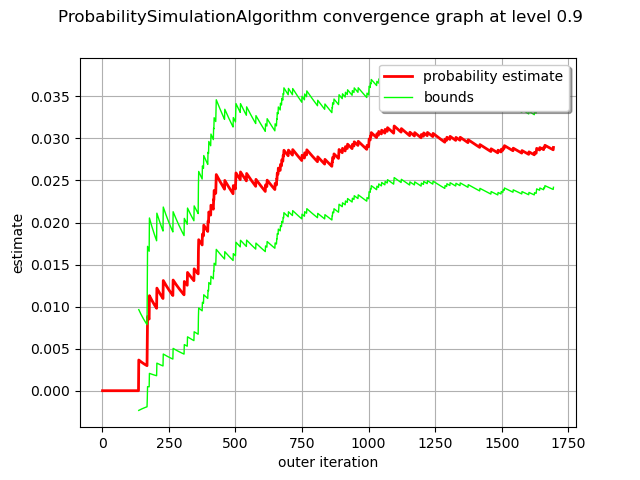
Draw the convergence graph and the confidence interval of level alpha. By default, alpha = 0.95.
alpha = 0.90
graph = algo.drawProbabilityConvergence(alpha)
view = viewer.View(graph)
Get the numerical samples of the input and output random vectors stored according to the History Strategy specified and used to evaluate the probability estimator and its variance.
inputSampleStored = model.getInputHistory()
outputSampleStored = model.getOutputHistory()
inputSampleStored
| v0 | v1 | |
|---|---|---|
| 0 | 337.3031 | 73381.5 |
| 1 | 332.1227 | 67377.29 |
| 2 | 303.6137 | 65820.79 |
| ... | ||
| 3385 | 297.6227 | 72351.49 |
| 3386 | 284.2359 | 76613.42 |
| 3387 | 242.5071 | 76285.83 |
Get the values of the estimator and its variance stored according to the History Strategy specified and used to draw the convergence graph.
estimator_probability_sample = algo.getConvergenceStrategy().getSample()[0]
estimator_variance_sample = algo.getConvergenceStrategy().getSample()[1]
print(estimator_probability_sample, estimator_variance_sample)
plt.show()
Out:
[0,-1] [0,-1]
Total running time of the script: ( 0 minutes 0.159 seconds)