Note
Click here to download the full example code
Subset Sampling
The objective is to evaluate a probability from the Subset sampling technique.
We consider the function  defined by:

and the input random vector  which follows a Normal distribution with independent components, and identical marginals with 0.25 mean and unit variance:
![\begin{align*}
X \sim \mathcal{N}(\mu = [0.25, 0.25], \sigma = [1,1], cov = I_2)
\end{align*}](../../_images/math/027950bcfd6baa6b0018a8b80c491d936fa48342.svg)
We want to evaluate the probability:

First, import the python modules:
from openturns import *
Create the probabilistic model  
Create the input random vector  :
:
X = RandomVector(Normal([0.25]*2, [1]*2, IdentityMatrix(2)))
Create the function  :
:
g=SymbolicFunction(['x1', 'x2'], ['20-(x1-x2)^2-8*(x1+x2-4)^3'])
print('function g: ', g)
Out:
function g: [x1,x2]->[20-(x1-x2)^2-8*(x1+x2-4)^3]
In order to be able to get the subset samples used in the algorithm, it is necessary to transform the SymbolicFunction into a MemoizeFunction:
g = MemoizeFunction(g)
Create the output random vector :
Y = CompositeRandomVector(g,X)
Create the event  
myEvent = ThresholdEvent(Y, LessOrEqual(), 0.0)
Evaluate the probability with the subset sampling technique
algo = SubsetSampling(myEvent)
In order to get all the inputs and outputs that realize the event, you have to mention it now:
algo.setKeepEventSample(True)
Now you can run the algorithm!
algo.run()
result = algo.getResult()
proba = result.getProbabilityEstimate()
print('Proba Subset = ',  proba)
print('Current coefficient of variation = ', result.getCoefficientOfVariation())
Out:
Proba Subset =  0.0003593589999999998
Current coefficient of variation =  0.08723895892311931
The length of the confidence interval of level  is:
is:
length95 = result.getConfidenceLength()
print('Confidence length (0.95) = ', result.getConfidenceLength())
Out:
Confidence length (0.95) = 0.00012289015357853586
which enables to build the confidence interval:
print('Confidence intervalle (0.95) = [', proba - length95/2, ', ', proba + length95/2, ']')
Out:
Confidence intervalle (0.95) = [ 0.00029791392321073184 , 0.00042080407678926775 ]
You can also get the succesive thresholds used by the algorithm:
levels =  algo.getThresholdPerStep()
print('Levels of g = ', levels)
Out:
Levels of g = [55.3061,18.6896,8.58722,0]
Draw the subset samples used by the algorithm
The following manipulations are possible onfly if you have created a MemoizeFunction that enables to store all the inputs and output of the function .
Get all the inputs where were evaluated:
inputSampleSubset = g.getInputHistory()
nTotal = inputSampleSubset.getSize()
print('Number of evaluations of g = ', nTotal)
Out:
Number of evaluations of g = 40000
Within each step of the algorithm, a sample of size  is created, where:
N =  algo.getMaximumOuterSampling()*algo.getBlockSize()
print('Size of each subset = ', N)
Out:
Size of each subset = 10000
You can get the number  of steps with:
Ns = algo.getNumberOfSteps()
print('Number of steps= ', Ns)
Out:
Number of steps= 4
and you can verify that is equal to  :
:
print('nTotal / N = ', int(nTotal / N))
Out:
nTotal / N = 4
Now, we can split the initial sample into subset samples of size :
list_subSamples = list()
for i in range(Ns):
    list_subSamples.append(inputSampleSubset[i*N:i*N +N])
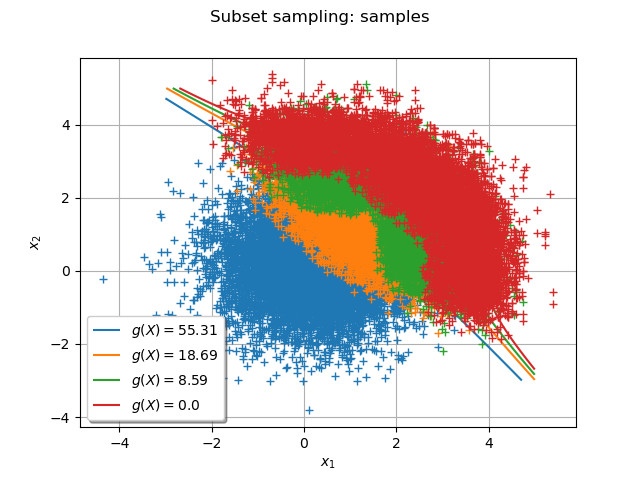
The following graph draws each subset sample and the frontier  where
where  is the threshold at the step
  :
:
graph = Graph()
graph.setAxes(True)
graph.setGrid(True)
graph.setTitle('Subset sampling: samples')
graph.setXTitle(r'$x_1$')
graph.setYTitle(r'$x_2$')
graph.setLegendPosition('bottomleft')
Add all the subset samples:
for i in range(Ns):
    cloud = Cloud(list_subSamples[i])
    #cloud.setPointStyle("dot")
    graph.add(cloud)
col = Drawable().BuildDefaultPalette(Ns)
graph.setColors(col)
Add the frontiers where is the threshold at the step :
gIsoLines =  g.draw([-3]*2, [5]*2, [128]*2)
dr = gIsoLines.getDrawable(0)
for i in range(levels.getSize()):
    dr.setLevels([levels[i]])
    dr.setLineStyle('solid')
    dr.setLegend(r'$g(X) = $' + str(round(levels[i], 2)))
    dr.setLineWidth(3)
    dr.setColor(col[i])
    graph.add(dr)
Show(graph)
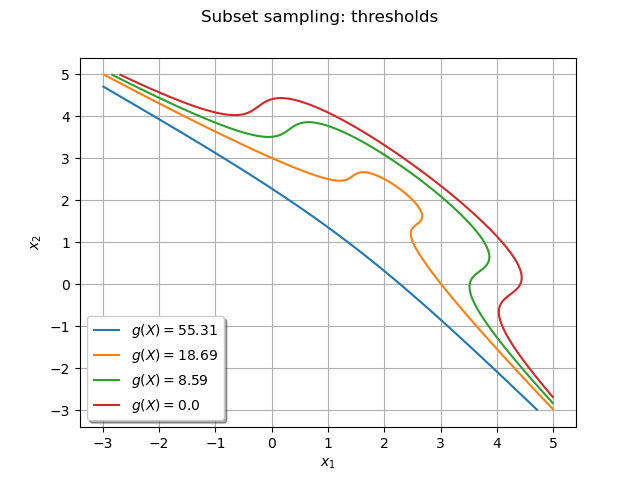
Draw the frontiers only
The following graph enables to understand the progresison of the algorithm:
graph=Graph()
graph.setAxes(True)
graph.setGrid(True)
dr = gIsoLines.getDrawable(0)
for i in range(levels.getSize()):
    dr.setLevels([levels[i]])
    dr.setLineStyle('solid')
    dr.setLegend(r'$g(X) = $' + str(round(levels[i], 2)))
    dr.setLineWidth(3)
    graph.add(dr)

graph.setColors(col)
graph.setLegendPosition('bottomleft')
graph.setTitle('Subset sampling: thresholds')
graph.setXTitle(r'$x_1$')
graph.setYTitle(r'$x_2$')

Show(graph)
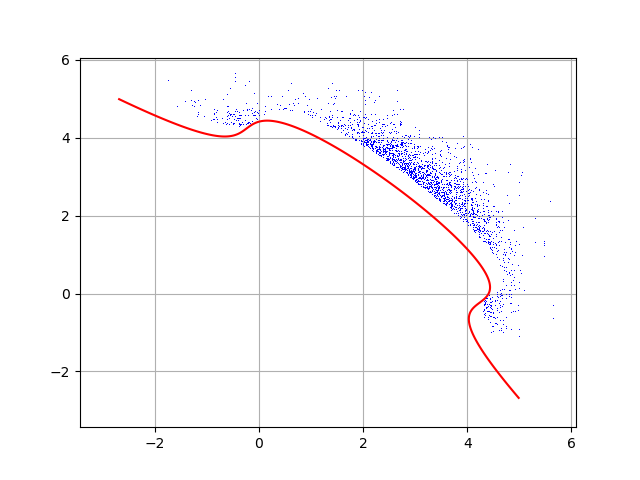
Get all the input and output points that realized the event
The following lines are possible only if you have mentionned that you wanted to keep the points that realize the event with the method algo.setKeepEventSample(True)
inputEventSample = algo.getEventInputSample()
outputEventSample = algo.getEventOutputSample()
print('Number of event realizations = ', inputEventSample.getSize())
Out:
Number of event realizations = 3590
Here we have to avoid a bug of the version 1.15 because getEventInputSample() gives the sample in the stadrad space: we have to push it backward to the physical space.
dist = Normal([0.25]*2, [1]*2, IdentityMatrix(2))
transformFunc = dist.getInverseIsoProbabilisticTransformation()
inputEventSample = transformFunc(inputEventSample)
Draw them! They are all in the event space.
graph=Graph()
graph.setAxes(True)
graph.setGrid(True)
cloud = Cloud(inputEventSample)
cloud.setPointStyle('dot')
graph.add(cloud)
gIsoLines =  g.draw([-3]*2, [5]*2, [1000]*2)
dr = gIsoLines.getDrawable(0)
dr.setLevels([0.0])
dr.setColor('red')
graph.add(dr)
Show(graph)
Total running time of the script: ( 0 minutes 0.754 seconds)