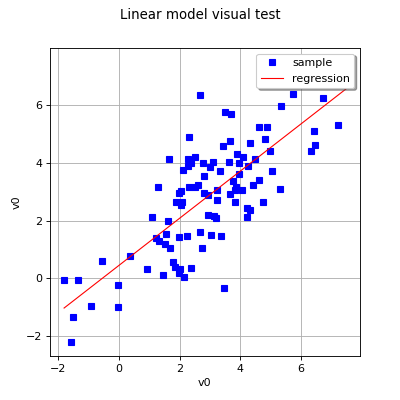
VisualTest_DrawLinearModel
(Source code, png, hires.png, pdf)

-
VisualTest_DrawLinearModel(*args)¶ Plot a 1D linear model.
- Parameters
- inputSample, outputSample2-d sequence of float (optional)
X and Y coordinates of the points the test is to be performed on. If inputSample and outputSample were the training samples of the linear model, there is no need to supply them (see example below).
- linearModelResult
LinearModelResult Linear model to plot.
- Returns
- graph
Graph The graph object
- graph
Examples
>>> import openturns as ot
>>> from openturns.viewer import View
>>> ot.RandomGenerator.SetSeed(0)
>>> dimension = 2
>>> R = ot.CorrelationMatrix(dimension)
>>> R[0, 1] = 0.8
>>> distribution = ot.Normal([3.0] * dimension, [2.0]* dimension, R)
>>> size = 200
>>> sample2D = distribution.getSample(size)
>>> firstSample = ot.Sample(size, 1)
>>> secondSample = ot.Sample(size, 1)
>>> for i in range(size):
...     firstSample[i] = ot.Point(1, sample2D[i, 0])
...     secondSample[i] = ot.Point(1, sample2D[i, 1])
>>> # Generate training Samples
>>> inputTrainSample = firstSample[0:size//2]
>>> outputTrainSample = secondSample[0:size//2]
>>> # Generate test Samples
>>> inputTestSample = firstSample[size//2:]
>>> outputTestSample = secondSample[size//2:]
>>> # Define and get the result of the linear model
>>> lmtest = ot.LinearModelAlgorithm(inputTrainSample, outputTrainSample).getResult()
>>> # Visual test on the training samples: no need to supply them again
>>> drawLinearModelVTest = ot.VisualTest.DrawLinearModel(lmtest)
>>> View(drawLinearModelVTest).show()
>>> # Visual test on the test samples
>>> drawLinearModelVTest2 = ot.VisualTest.DrawLinearModel(inputTestSample, outputTestSample, lmtest)
>>> View(drawLinearModelVTest2).show()
 OpenTURNS