Note
Click here to download the full example code
Draw the empirical CDF
In this example we are going to draw the empirical CDF of an unidimensional sample.
from __future__ import print_function
import openturns as ot
import openturns.viewer as viewer
from matplotlib import pylab as plt
ot.Log.Show(ot.Log.NONE)
Then create a sample from a gaussian distribution.
size = 100
normal = ot.Normal(1)
sample = normal.getSample(size)
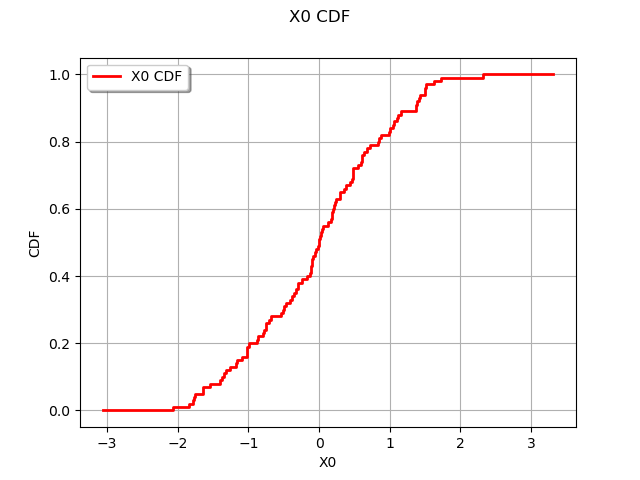
We draw the empirical CDF based on the UserDefined distribution. By default, the drawCDF method requires no input argument.
distribution = ot.UserDefined(sample)
graph = distribution.drawCDF()
view = viewer.View(graph)
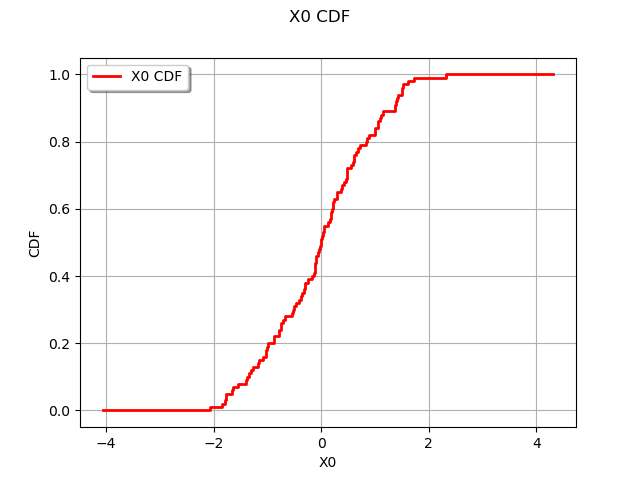
If required, we can specify the interval that we want to draw. In the following example, these bounds are computed from the minimum and the maximum of the sample.
xmin = sample.getMin()[0] - 2.0
xmax = sample.getMax()[0] + 2.0
graph = ot.UserDefined(sample).drawCDF(xmin, xmax)
view = viewer.View(graph)
plt.show()
Total running time of the script: ( 0 minutes 0.196 seconds)