Note
Click here to download the full example code
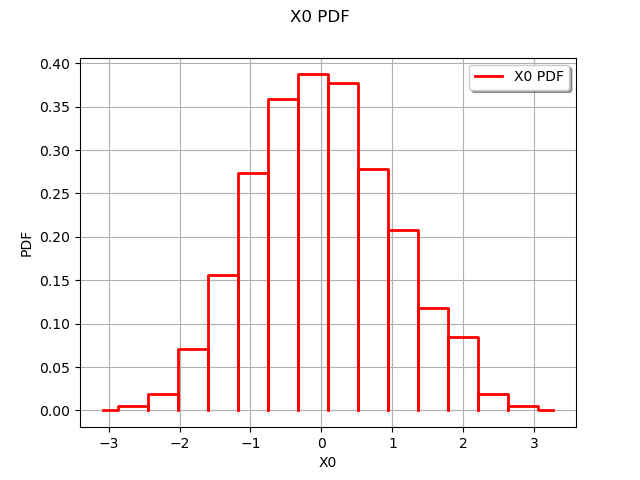
Draw an histogram
In this example we are going to a plot a histogram from a unidimensional sample.
from __future__ import print_function
import openturns as ot
import openturns.viewer as viewer
from matplotlib import pylab as plt
ot.Log.Show(ot.Log.NONE)
Create data to visualize
size = 500
normal = ot.Normal(1)
sample = normal.getSample(size)
Draw histogram
graph = ot.HistogramFactory().build(sample).drawPDF()
view = viewer.View(graph)
plt.show()
Total running time of the script: ( 0 minutes 0.105 seconds)