Note
Click here to download the full example code
Test Normality
Normal fitting test using the Henry line
In this paragraph we perform a visual goodness-of-fit test for a univariate normal distribution using the Henry line test, which is the QQ plot adapted for Gaussian distributions.
from __future__ import print_function
import openturns as ot
import openturns.viewer as viewer
from matplotlib import pylab as plt
ot.Log.Show(ot.Log.NONE)
We first create the data :
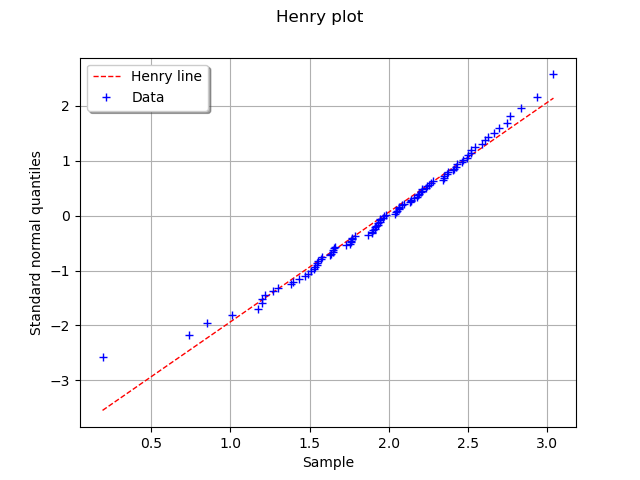
distribution = ot.Normal(2.0, 0.5)
sample1 = distribution.getSample(100)
We draw the Henry line plot and expect a good fitting :
graph = ot.VisualTest_DrawHenryLine(sample1)
view = viewer.View(graph)
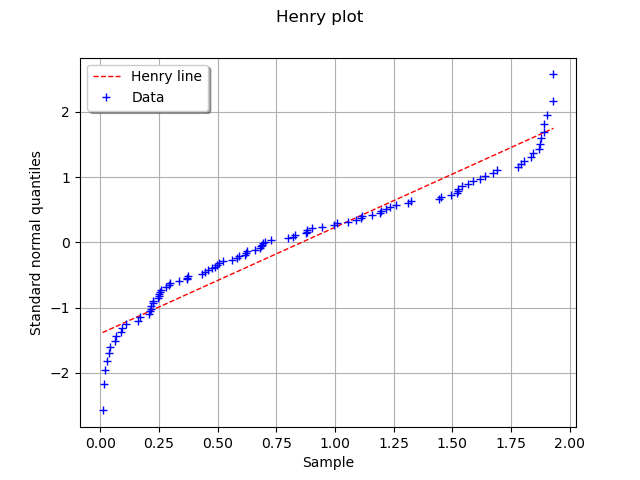
For comparison sake e draw the Henry line plot for a Beta distribution. The result is expected to be bad.
sample2 = ot.Beta(0.7, 0.9, 0.0, 2.0).getSample(100)
graph = ot.VisualTest_DrawHenryLine(sample2)
view = viewer.View(graph)
Normality tests
We use two tests to check whether a sample follows a normal distribution :
the Anderson-Darling test
the Cramer-Von Mises test
We first generate two samples, one from a standard unit gaussian and another from a Gumbel
distribution with parameters  and
and  .
.
sample1 = ot.Normal().getSample(200)
sample2 = ot.Gumbel().getSample(200)
We test the normality of the sample. We can display the result of the test as a yes/no answer with the getBinaryQualityMeasure. We can retrieve the p-value and the threshold with the getPValue and getThreshold methods.
test_result = ot.NormalityTest.AndersonDarlingNormal(sample1)
print('Component is normal?', test_result.getBinaryQualityMeasure(),
      'p-value=%.6g' % test_result.getPValue(),
      'threshold=%.6g' % test_result.getThreshold())
Out:
Component is normal? False p-value=0.021519 threshold=0.05
test_result = ot.NormalityTest.AndersonDarlingNormal(sample2)
print('Component is normal?', test_result.getBinaryQualityMeasure(),
      'p-value=%.6g' % test_result.getPValue(),
      'threshold=%.6g' % test_result.getThreshold())
Out:
Component is normal? False p-value=1.45169e-10 threshold=0.05
test_result = ot.NormalityTest.CramerVonMisesNormal(sample1)
print('Component is normal?', test_result.getBinaryQualityMeasure(),
      'p-value=%.6g' % test_result.getPValue(),
      'threshold=%.6g' % test_result.getThreshold())
Out:
Component is normal? False p-value=0.0438816 threshold=0.05
test_result = ot.NormalityTest.CramerVonMisesNormal(sample2)
print('Component is normal?', test_result.getBinaryQualityMeasure(),
      'p-value=%.6g' % test_result.getPValue(),
      'threshold=%.6g' % test_result.getThreshold())
Out:
Component is normal? False p-value=4.33705e-08 threshold=0.05
Total running time of the script: ( 0 minutes 0.201 seconds)