Note
Click here to download the full example code
How to fill an area
# sphinx_gallery_thumbnail_number = 2
In this example, we show how to fill specified area with a given color.
import openturns as ot
import openturns.viewer as viewer
from matplotlib import pylab as plt
ot.Log.Show(ot.Log.NONE)
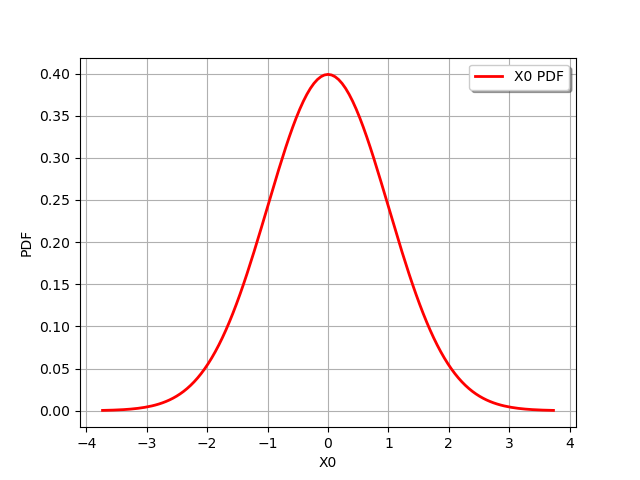
We generate a sample from a standard gaussian distribution.
dist = ot.Normal()
graph = dist.drawPDF()
view = viewer.View(graph)
def linearSample(xmin, xmax, npoints):
    '''Returns a sample created from a regular grid
    from xmin to xmax with npoints points.'''
    step = (xmax-xmin)/(npoints-1)
    rg = ot.RegularGrid(xmin, step, npoints)
    vertices = rg.getVertices()
    return vertices
a = 1.
b = 2.
nplot = 100  # Number of points in the plot
x = linearSample(a, b, nplot)
y = dist.computePDF(x)
The following function uses the PolygonArray class to create a area filled with a given color.
def drawInTheBounds(vLow, vUp, n_test):
    '''
    Draw the area within the bounds.
    '''
    palette = ot.Drawable.BuildDefaultPalette(2)
    myPaletteColor = palette[1]
    polyData = [[vLow[i], vLow[i+1], vUp[i+1], vUp[i]]
                for i in range(n_test-1)]
    polygonList = [ot.Polygon(
        polyData[i], myPaletteColor, myPaletteColor) for i in range(n_test-1)]
    boundsPoly = ot.PolygonArray(polygonList)
    return boundsPoly
Compute the bounds to fill: the lower vertical bound is zero and the upper vertical bound is the PDF.
vLow = [[x[i, 0], 0.] for i in range(nplot)]
vUp = [[x[i, 0], y[i, 0]] for i in range(nplot)]
area = dist.computeCDF(b) - dist.computeCDF(a)
boundsPoly = drawInTheBounds(vLow, vUp, nplot)
graph = dist.drawPDF()
graph.add(boundsPoly)
graph.setTitle("Area = %.3f" % (area))
graph.setLegends([""])
view = viewer.View(graph)
plt.show()
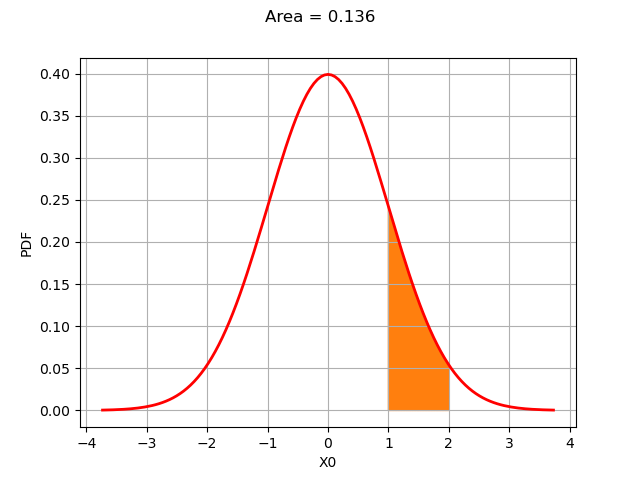
The CDF difference is equal to the area under the curve.
Total running time of the script: ( 0 minutes 0.242 seconds)