Note
Click here to download the full example code
Create a deterministic design of experiments
from __future__ import print_function
import openturns as ot
import openturns.viewer as viewer
from matplotlib import pylab as plt
ot.Log.Show(ot.Log.NONE)
Four types of deterministic designs of experiments are available:
Each type of deterministic design is discretized differently according to a number of levels.
Functionally speaking, a design is a Sample that lies within the unit cube and can be scaled and moved to cover the desired box.
We will use the following function to plot bi-dimensional samples.
def drawBidimensionalSample(sample, title):
    n = sample.getSize()
    graph = ot.Graph("%s, size=%d" % (title, n), r"$X_1$", r"$X_2$", True, '')
    #cloud = ot.Cloud(sample)
    cloud = ot.Cloud(sample, "blue", "fsquare", "")
    graph.add(cloud)
    return graph
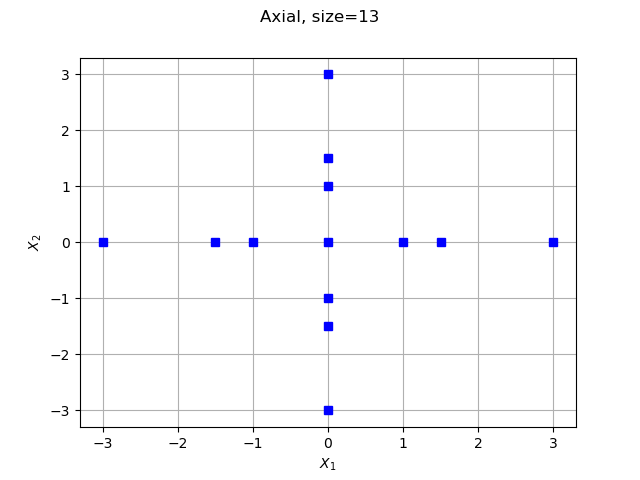
Axial design
levels = [1.0, 1.5, 3.0]
experiment = ot.Axial(2, levels)
sample = experiment.generate()
graph = drawBidimensionalSample(sample, "Axial")
view = viewer.View(graph)
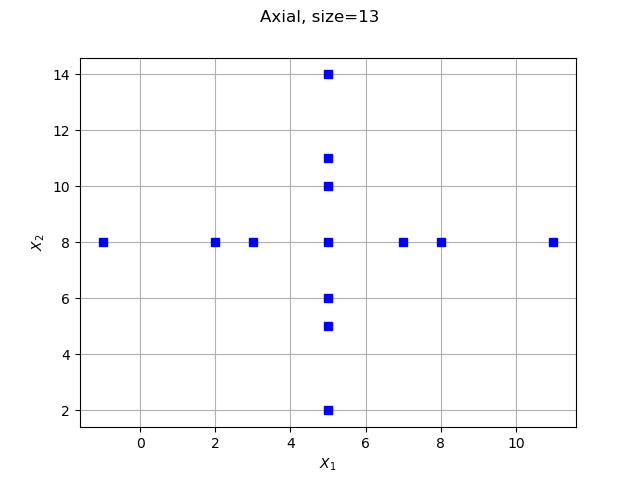
Use *= to rescale and += to move a design. Pay attention to the grid in the next graph.
sample *= 2.0
sample += [5.0, 8.0]
graph = drawBidimensionalSample(sample, "Axial")
view = viewer.View(graph)
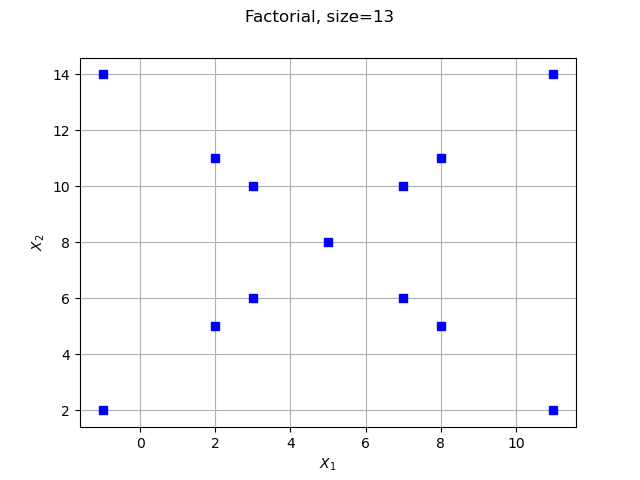
Factorial design
experiment = ot.Factorial(2, levels)
sample = experiment.generate()
sample *= 2.0
sample += [5.0, 8.0]
graph = drawBidimensionalSample(sample, "Factorial")
view = viewer.View(graph)
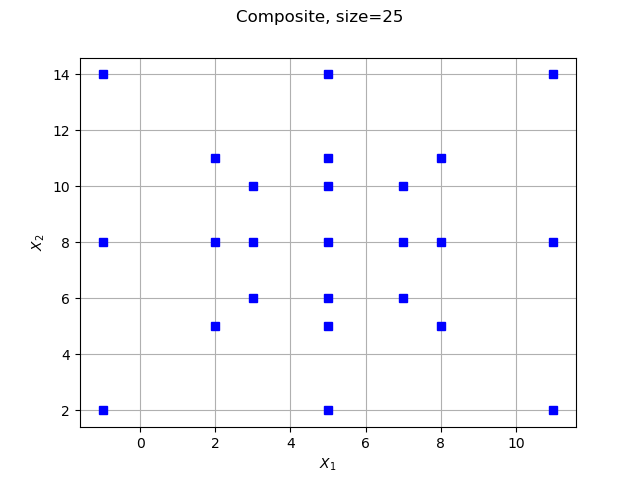
Composite design
A composite design is a stratified design of experiments enabling to create a pattern as the union of an Axial pattern and a Factorial one. The number of points generated is .
experiment = ot.Composite(2, levels)
sample = experiment.generate()
sample *= 2.0
sample += [5.0, 8.0]
graph = drawBidimensionalSample(sample, "Composite")
view = viewer.View(graph)
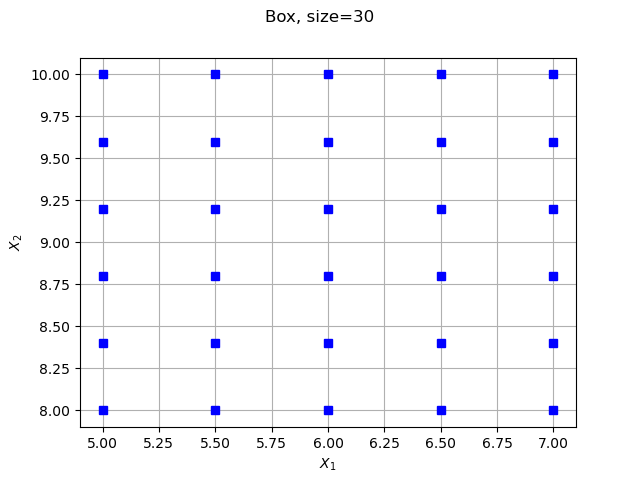
Grid design
levels = [3, 4]
experiment = ot.Box(levels)
sample = experiment.generate()
sample *= 2.0
sample += [5.0, 8.0]
graph = drawBidimensionalSample(sample, "Box")
view = viewer.View(graph)
plt.show()
Total running time of the script: ( 0 minutes 0.516 seconds)
 OpenTURNS