Note
Click here to download the full example code
Use the Importance Sampling algorithm
In this example we estimate a failure probability with the importance sampling simulation algorithm provided by the ImportanceSamplingExperiment class.
The main steps of this method are:
run a FORM analysis,
create an importance distribution based on the results of the FORM results,
run a sampling-based probability estimate algorithm.
We shall consider the analytical example of a cantilever beam.
Define the cantilever beam model
from __future__ import print_function
from openturns.usecases import cantilever_beam as cantilever_beam
import openturns as ot
import openturns.viewer as viewer
from matplotlib import pylab as plt
ot.Log.Show(ot.Log.NONE)
The cantilever beam example can be accessed in the usecases module :
cb = cantilever_beam.CantileverBeam()
The joint probability distribution of the input parameters is stored in the object cb :
distribution = cb.distribution
We create the model.
model = cb.model
Define the event
We create the event whose probability we want to estimate.
vect = ot.RandomVector(distribution)
G = ot.CompositeRandomVector(model, vect)
event = ot.ThresholdEvent(G, ot.Greater(), 0.30)
Run a FORM analysis
Define a solver
optimAlgo = ot.Cobyla()
optimAlgo.setMaximumEvaluationNumber(1000)
optimAlgo.setMaximumAbsoluteError(1.0e-10)
optimAlgo.setMaximumRelativeError(1.0e-10)
optimAlgo.setMaximumResidualError(1.0e-10)
optimAlgo.setMaximumConstraintError(1.0e-10)
Run FORM
algo = ot.FORM(optimAlgo, event, distribution.getMean())
algo.run()
result = algo.getResult()
Configure an importance sampling algorithm
The getStandardSpaceDesignPoint method returns the design point in the U-space.
standardSpaceDesignPoint = result.getStandardSpaceDesignPoint()
standardSpaceDesignPoint
The key point is to define the importance distribution in the U-space. To define it, we use a multivariate standard Gaussian centered around the design point in the U-space.
dimension = distribution.getDimension()
dimension
Out:
4
myImportance = ot.Normal(dimension)
myImportance.setMean(standardSpaceDesignPoint)
myImportance
Create the design of experiment corresponding to importance sampling. This generates a WeightedExperiment with weights fitting to the importance distribution.
experiment = ot.ImportanceSamplingExperiment(myImportance)
type(experiment)
Create the standard event corresponding to the event. This pushes the original problem to the U-space, with Gaussian independent marginals.
standardEvent = ot.StandardEvent(event)
Run the importance sampling simulation
We then create the simulation algorithm.
algo = ot.ProbabilitySimulationAlgorithm(standardEvent, experiment)
algo.setMaximumCoefficientOfVariation(0.1)
algo.setMaximumOuterSampling(40000)
algo.run()
We can retrieve results of this estimate :
result = algo.getResult()
probability = result.getProbabilityEstimate()
print("Probability = ", probability)
Out:
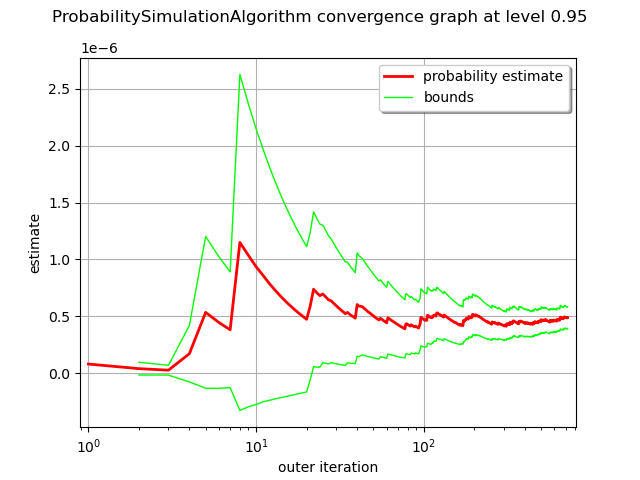
Probability = 4.897240963541003e-07
In order to compute the confidence interval, we use the getConfidenceLength method, which returns the length of the interval. In order to compute the bounds of the interval, we divide this length by 2.
alpha = 0.05
pflen = result.getConfidenceLength(1-alpha)
print("%.2f%% confidence interval = [%.10f,%.10f]" % (
    (1-alpha)*100, probability-pflen/2, probability+pflen/2))
Out:
95.00% confidence interval = [0.0000003939,0.0000005856]
We can observe the convergence history of the estimate with the drawProbabilityConvergence method which displays the estimate and confidence interval evolution.
graph = algo.drawProbabilityConvergence()
graph.setLogScale(ot.GraphImplementation.LOGX)
view = viewer.View(graph)

Total running time of the script: ( 0 minutes 0.244 seconds)
 OpenTURNS