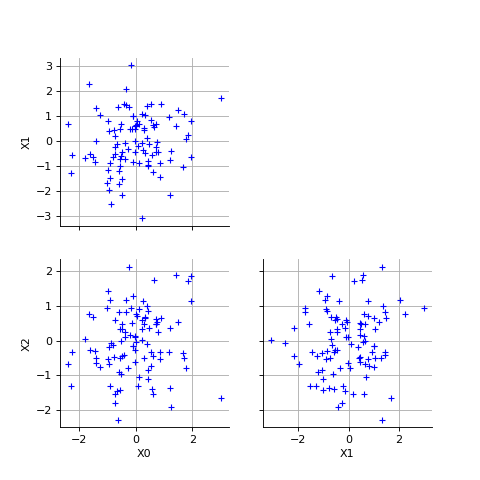
VisualTest_DrawPairs
(Source code, png, hires.png, pdf)

- VisualTest_DrawPairs(sample)
Draw 2-d projections of a multivariate sample.
- Parameters
- sample2-d sequence of float
Samples to draw.
- Returns
- graph
Graph The graph object
- graph
Notes
The point style and the color are given by ‘Drawable-DefaultPointStyle’ and ‘Drawable-DefaultColor’ keys in
ResourceMap.Examples
>>> import openturns as ot
>>> from openturns.viewer import View
>>> ot.RandomGenerator.SetSeed(0)
>>> dim = 3
>>> R = ot.CorrelationMatrix(dim)
>>> R[0, 1] = 0.8
>>> distribution = ot.Normal([3.0] * dim, [2.0]* dim, R)
>>> size = 100
>>> sample = distribution.getSample(size)
>>> clouds = ot.VisualTest.DrawPairs(sample)
>>> View(clouds).show()
 OpenTURNS