PlotDesign
(Source code, png, hires.png, pdf)

- PlotDesign(design, bounds=None, subdivisions=None, figure=None, axes=[], plot_kw=None, axes_kw=None, text_kw=None, enableTicks=True)
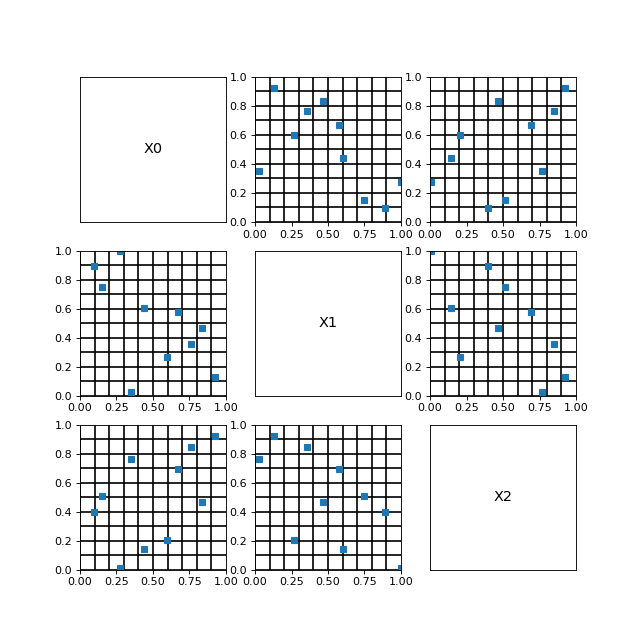
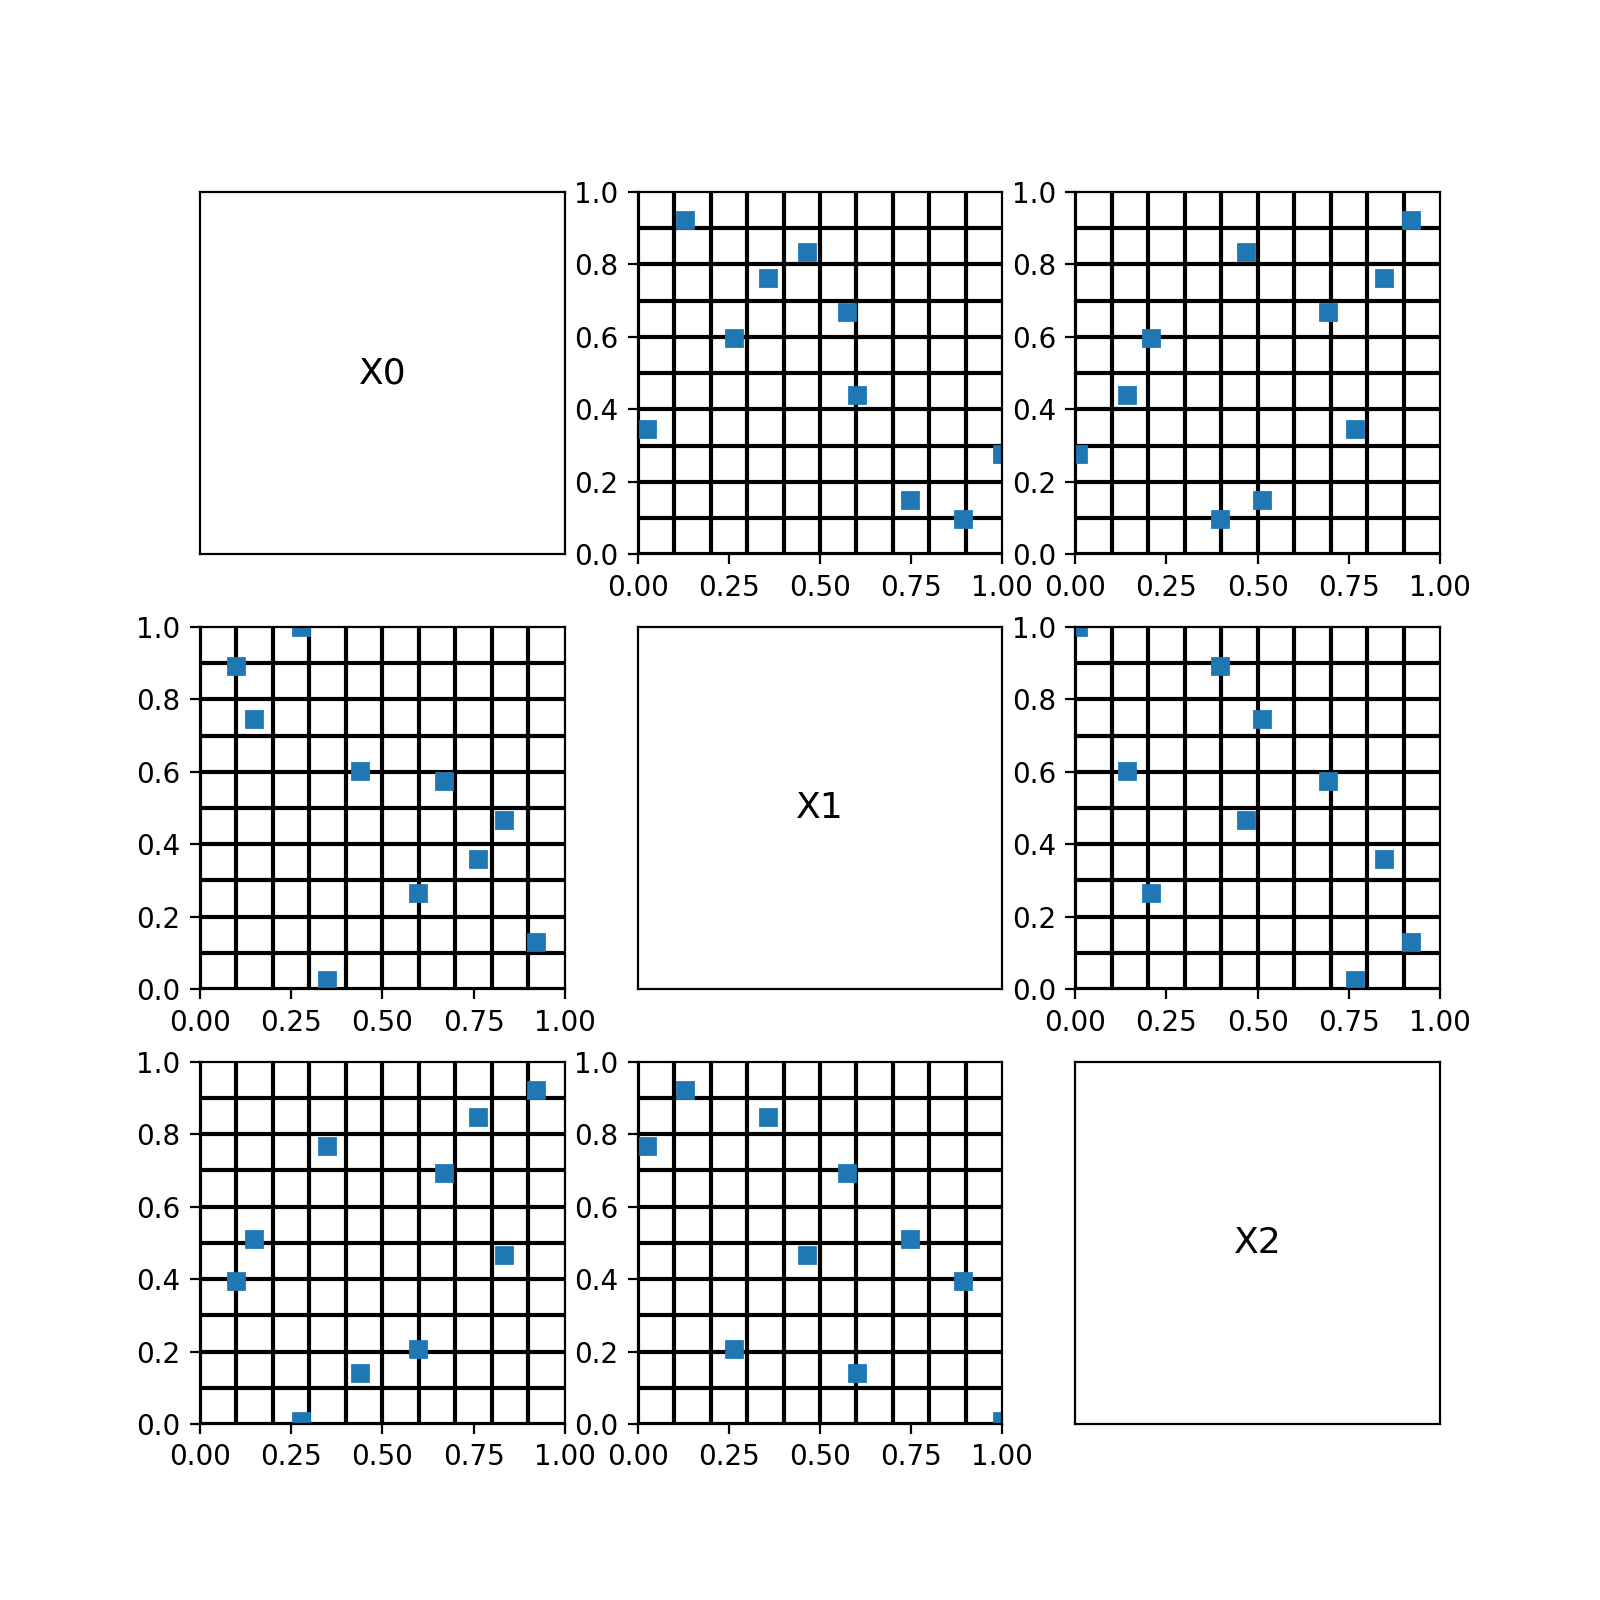
Plot a design using a scatter plot. If the dimension is equal to 2, then plots the 2D projection. If the dimension is greater or equal to 3, then plots all 2D projections.
In addition, the function plots a grid, i.e. horizontal and vertical lines to see the dispersion of the points. This allows to see how the sample fills the space.
- Parameters
- design2-d sequence of float
The sample.
- figurea Matplotlib figure.
If this is not None, then create a new figure. Otherwise, use the existing figure.
- axesa Matplotlib axis.
If empty, then create new axes.
- bounds: :class:`~openturns.Interval`
Bounds of the plot. By default, compute the bounds from the sample.
- subdivisionsa list of integers
Number of subdivisions in the each direction. By default, set the number of subdivisions in each direction as equal to the sample size.
- enableTicks :
A boolean. If True, then the ticks are plotted.
- Returns
- figmatplotlib figure
Figure representing the sample.
Examples
Plot a sample in 2 dimensions.
>>> import openturns as ot
>>> from openturns.viewer import PlotDesign
>>> dim = 20
>>> X = [ot.Uniform()] * dim
>>> distribution = ot.ComposedDistribution(X)
>>> sampleSize = 10
>>> sample = distribution.getSample(sampleSize)
>>> fig = PlotDesign(sample)
Plot a sample in 5 dimensions.
>>> import openturns as ot
>>> from openturns.viewer import PlotDesign
>>> dim = 5
>>> size = 10
>>> distribution = ot.ComposedDistribution([ot.Uniform(0.0, 1.0)]*dim)
>>> bounds = distribution.getRange()
>>> lhs = ot.LHSExperiment(distribution, size)
>>> sample = lhs.generate()
>>> subdivisions = [size]*dim
>>> fig = PlotDesign(sample, bounds, subdivisions)