Note
Go to the end to download the full example code
FAST sensitivity indices
This example will demonstrate how to quantify the correlation between the input variables and the output variable of a model using the FAST method, based upon the Fourier decomposition of the model response, which is a relevant alternative to the classical simulation approach for computing Sobol sensitivity indices.
The FAST indices, like the Sobol indices, allow to evaluate the importance of a single variable or a specific set of variables.
In theory, FAST indices range is ; the closer to 1 the
index is, the greater the model response sensitivity to the variable is.
The FAST method compute the first and total order indices.
The first order indices evaluate the importance of one variable at a time
( indices, with
the input dimension of the model).
The total indices give the relative importance of every variables except
the variable
, for every variable.
from openturns.usecases import ishigami_function
import openturns as ot
import openturns.viewer as viewer
from matplotlib import pylab as plt

ot.Log.Show(ot.Log.NONE)
We load the Ishigami model from the usecases module :
im = ishigami_function.IshigamiModel()
The IshigamiModel data class contains the input independent joint distribution :
distribution = im.distributionX
and the Ishigami function :
model = im.model
size = 400
sensitivityAnalysis = ot.FAST(model, distribution, size)
# Compute the first order indices (first and total order indices are
# computed together)
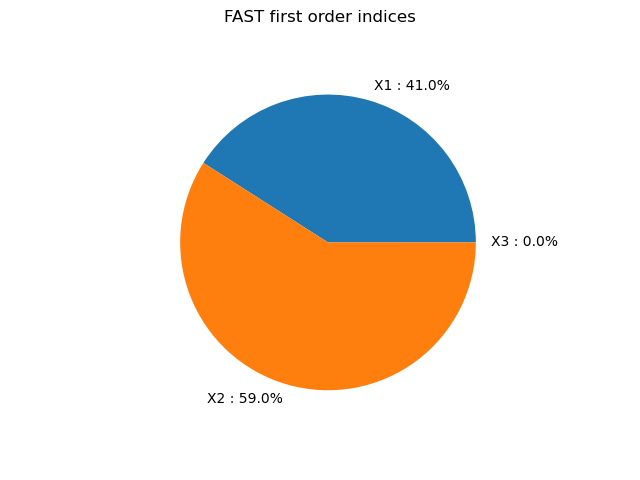
firstOrderIndices = sensitivityAnalysis.getFirstOrderIndices()
# Retrieve total order indices
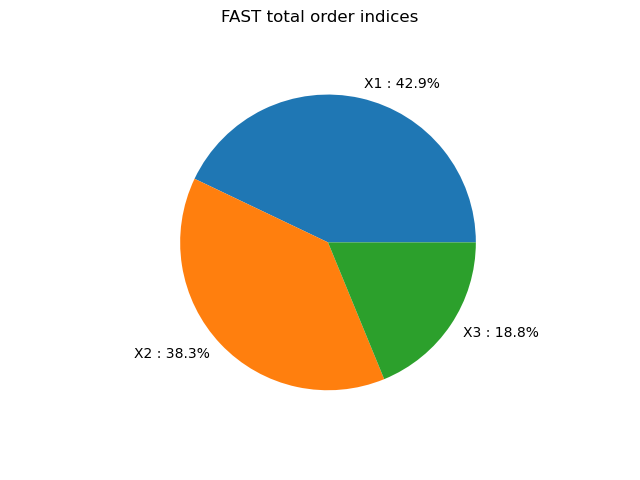
totalOrderIndices = sensitivityAnalysis.getTotalOrderIndices()
Print indices
print("First order FAST indices:", firstOrderIndices)
print("Total order FAST indices:", totalOrderIndices)
First order FAST indices: [0.307822,0.443645,6.61643e-06]
Total order FAST indices: [0.546652,0.487709,0.23937]
graph = ot.SobolIndicesAlgorithm.DrawImportanceFactors(
    firstOrderIndices, distribution.getDescription(), "FAST first order indices"
)
view = viewer.View(graph)

graph = ot.SobolIndicesAlgorithm.DrawImportanceFactors(
    totalOrderIndices, distribution.getDescription(), "FAST total order indices"
)
view = viewer.View(graph)
plt.show()

Total running time of the script: ( 0 minutes 0.082 seconds)
 OpenTURNS