Note
Go to the end to download the full example code.
Cross-cuts of conditional distributions in 3-d
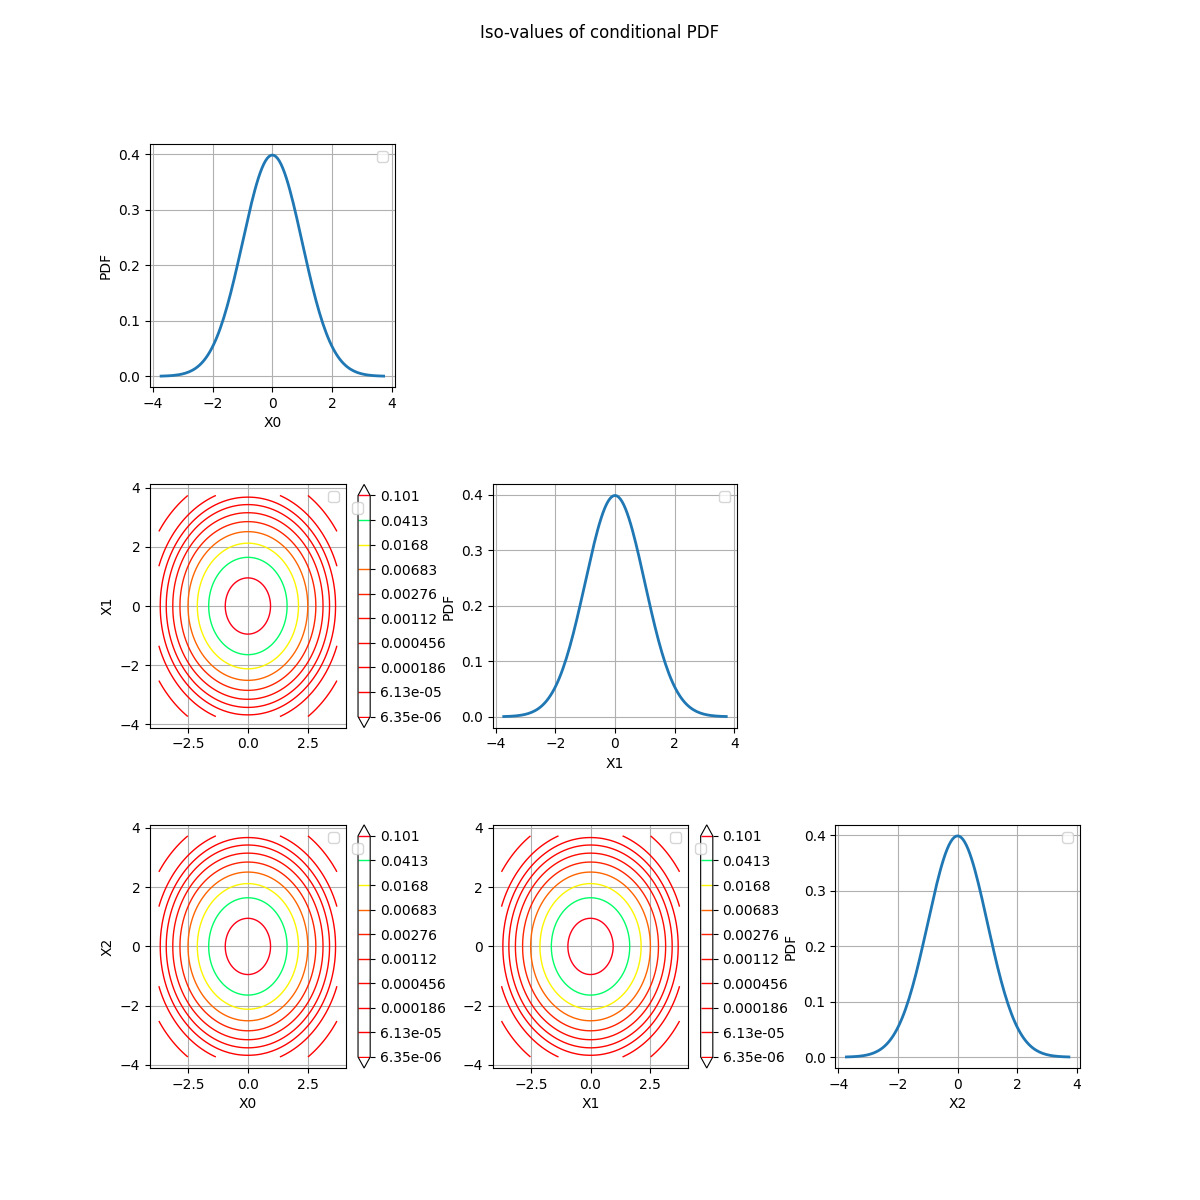
Conditioning is a way to reduce the dimensionnality of a multivariate distribution. It allows to plot the d
import openturns as ot
import otbenchmark as otb
import matplotlib.pyplot as plt
distribution = ot.Normal(3)
referencePoint = distribution.getMean()
Print the iso-values of the distribution
inputDimension = distribution.getDimension()
description = distribution.getDescription()
crossCut = otb.CrossCutDistribution(distribution)
fig = crossCut.drawConditionalPDF(referencePoint)
# Remove the legend labels because there
# are too many for such a small figure
for ax in fig.axes:
    ax.legend("")
# Increase space between sub-figures so that
# there are no overlap
plt.subplots_adjust(hspace=0.4, wspace=0.4)

Descr =  1 0
Descr =  2 0
Descr =  2 1
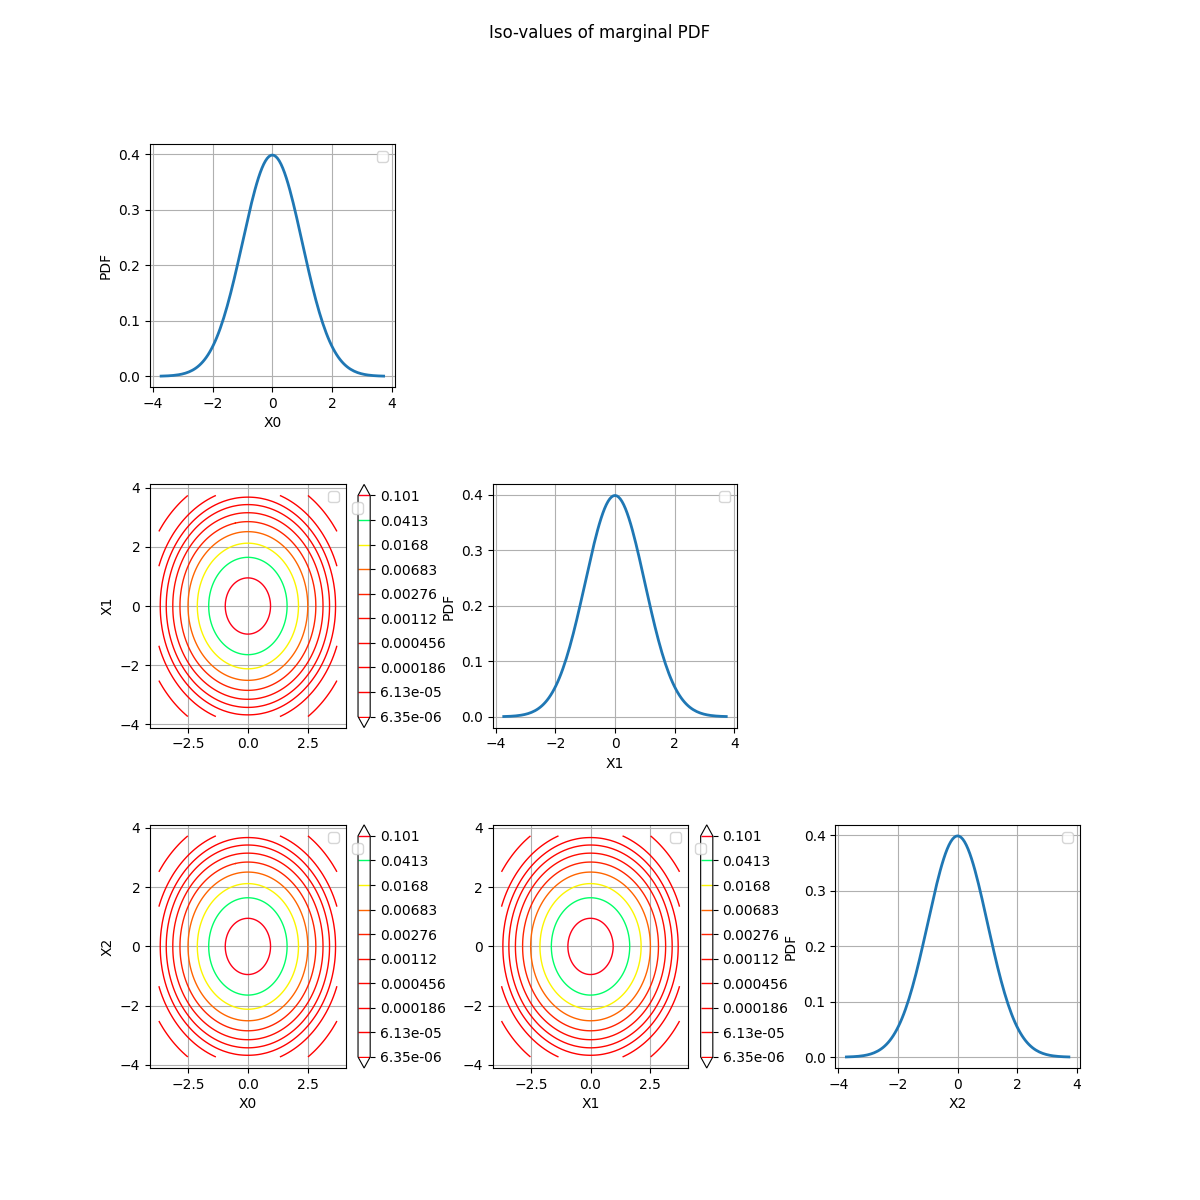
fig = crossCut.drawMarginalPDF()
# Remove the legend labels because there
# are too many for such a small figure
for ax in fig.axes:
    ax.legend("")
# Increase space between sub-figures so that
# there are no overlap
plt.subplots_adjust(hspace=0.4, wspace=0.4)

Total running time of the script: (0 minutes 1.463 seconds)
 otbenchmark