Note
Go to the end to download the full example code.
Benchmark the Flooding test function
import openturns as ot
import otbenchmark as otb
import openturns.viewer as otv
problem = otb.FloodingSensitivity()
print(problem)
name = Flooding
distribution = ComposedDistribution(TruncatedDistribution(Gumbel(beta = 558, gamma = 1013), bounds = [0, (19000.8) +inf[), TruncatedDistribution(Normal(mu = 30, sigma = 7.5), bounds = [0, (87.3797) +inf[), Uniform(a = 49, b = 51), Uniform(a = 54, b = 56), Uniform(a = 7, b = 9), Triangular(a = 55, m = 55.5, b = 56), Triangular(a = 4990, m = 5000, b = 5010), Triangular(a = 295, m = 300, b = 305), IndependentCopula(dimension = 8))
function = [Q,Ks,Zv,Zm,Hd,Zb,L,B]->[(Q / (Ks * B * sqrt((Zm - Zv) / L)))^(3.0 / 5.0) + Zv - Zb - Hd]
firstOrderIndices = [0.38,0.13,0.25,0,0.19,0.02,0,0]
totalOrderIndices = [0.4,0.15,0.25,0.01,0.19,0.02,0,0]
distribution = problem.getInputDistribution()
model = problem.getFunction()
Exact first and total order
exact_first_order = problem.getFirstOrderIndices()
exact_first_order
exact_total_order = problem.getTotalOrderIndices()
exact_total_order
Plot the function
Create X/Y data
ot.RandomGenerator.SetSeed(0)
size = 200
inputDesign = ot.MonteCarloExperiment(distribution, size).generate()
outputDesign = model(inputDesign)
dimension = distribution.getDimension()
full_sample = ot.Sample(size, 1 + dimension)
full_sample[:, range(dimension)] = inputDesign
full_sample[:, dimension] = outputDesign
full_description = list(inputDesign.getDescription())
full_description.append(outputDesign.getDescription()[0])
full_sample.setDescription(full_description)
marginal_distribution = ot.ComposedDistribution(
[
ot.KernelSmoothing().build(full_sample.getMarginal(i))
for i in range(1 + dimension)
]
)
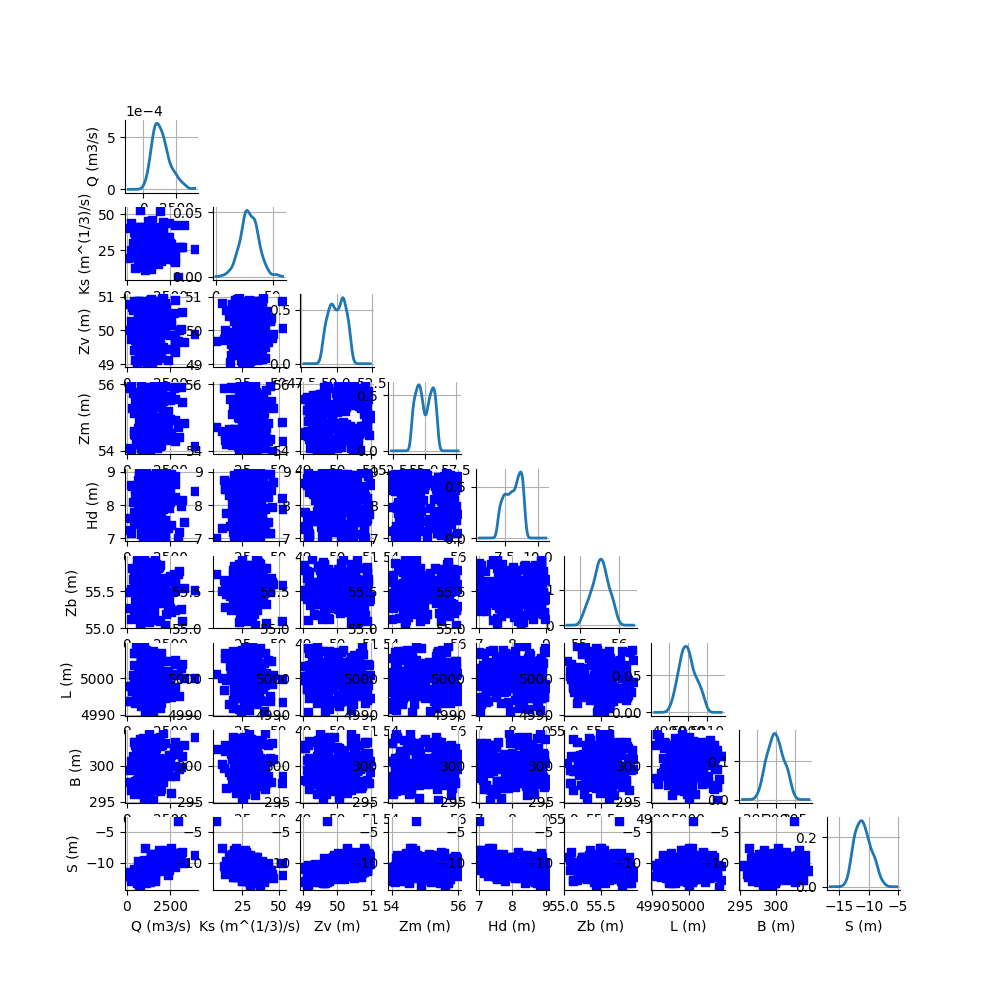
clouds = ot.VisualTest.DrawPairsMarginals(full_sample, marginal_distribution)
_ = otv.View(clouds, figure_kw={"figsize": (10.0, 10.0)})
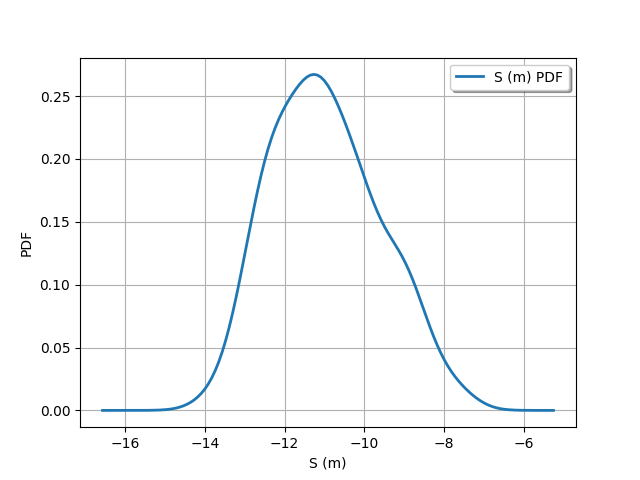
output_distribution = ot.KernelSmoothing().build(outputDesign)
_ = otv.View(output_distribution.drawPDF())
Perform sensitivity analysis
Create X/Y data
ot.RandomGenerator.SetSeed(0)
size = 10000
inputDesign = ot.SobolIndicesExperiment(distribution, size).generate()
outputDesign = model(inputDesign)
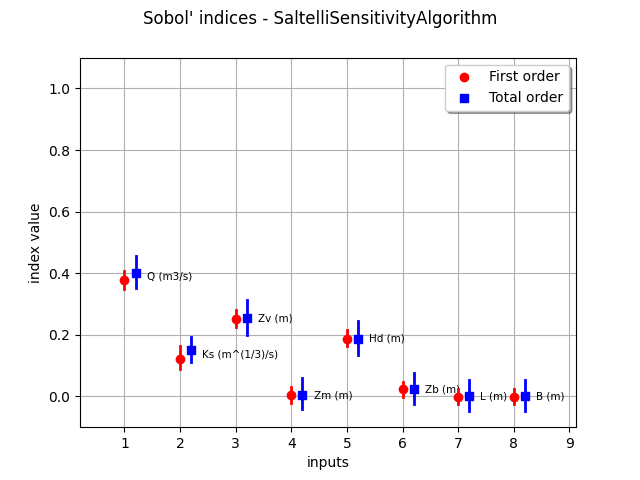
Compute first order indices using the Saltelli estimator
sensitivityAnalysis = ot.SaltelliSensitivityAlgorithm(inputDesign, outputDesign, size)
computed_first_order = sensitivityAnalysis.getFirstOrderIndices()
computed_total_order = sensitivityAnalysis.getTotalOrderIndices()
Compare with exact results
print("Sample size : ", size)
# First order
print("Computed first order = ", computed_first_order)
print("Exact first order = ", exact_first_order)
# Total order
print("Computed total order = ", computed_total_order)
print("Exact total order = ", exact_total_order)
Sample size :  10000
Computed first order =  [0.377466,0.122976,0.250058,0.00377566,0.18736,0.0225314,-0.00071699,-0.00064024]
Exact first order =  [0.38,0.13,0.25,0,0.19,0.02,0,0]
Computed total order =  [0.399912,0.149459,0.253482,0.00499922,0.186917,0.0233599,-1.47072e-06,0.000194748]
Exact total order =  [0.4,0.15,0.25,0.01,0.19,0.02,0,0]
_ = otv.View(sensitivityAnalysis.draw())
otv.View.ShowAll()
Total running time of the script: (0 minutes 2.181 seconds)