Note
Go to the end to download the full example code.
Function graph meshing
In this example we will see how to define a function graph.
import openturns as ot
import openturns.viewer as otv
import otmeshing as otm
Define the surface equation
a = [-4.0] * 3
b = [4.0] * 3
f = ot.SymbolicFunction(["x0", "x1"], ["cos(pi_*x0)*sin(pi_*x1)^2"])
f.setInputDescription([r"$x_0$", r"$x_1$"])
f.setOutputDescription([r"$x_2$"])
inputInterval = ot.Interval(a[:2], b[:2])
inputDiscretization = [16] * 2
mesher = otm.FunctionGraphMesher(inputInterval, inputDiscretization)
outputIndex = 2
mesh = mesher.build(f, outputIndex, a[2], b[2])
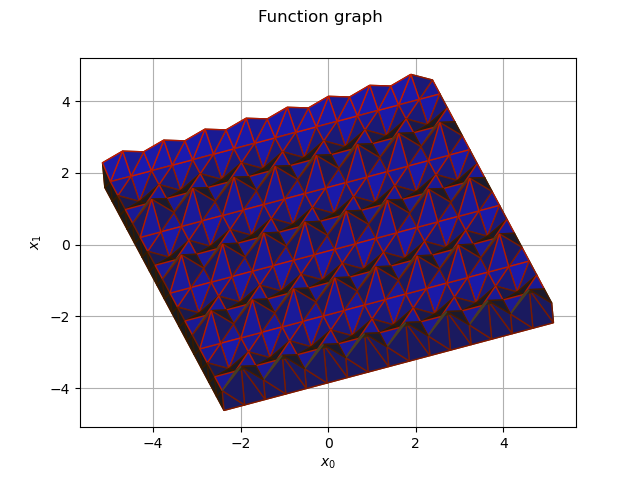
Plot the function graph
shading = True
thetaX, thetaY, thetaZ = 6.1, 3.7, 4.3
drawEdge = True
graph = mesh.draw3D(drawEdge, thetaX, thetaY, thetaZ, shading)
graph.setLegendPosition("upper left")
graph.setTitle("Function graph")
view = otv.View(graph)