Note
Go to the end to download the full example code.
Polynomial chaos graphs
In this example we are going to create some graphs useful after the launch of a polynomial chaos algorithm. More precisely, we draw some members of the 1D polynomial family.
import openturns as ot
import openturns.viewer as viewer
from matplotlib import pylab as plt

ot.Log.Show(ot.Log.NONE)
def drawFamily(factory, degreeMax=5):
    # Load all the valid colors
    colorList = ot.Drawable.BuildDefaultPalette(degreeMax)

    # Create a fine title
    titleJacobi = factory.__class__.__name__.replace("Factory", "") + " polynomials"

    # Create an empty graph which will be fulfilled
    # with curves
    graphJacobi = ot.Graph(titleJacobi, "z", "polynomial values", True, "upper right")

    # Fix the number of points for the graph
    pointNumber = 101

    # Bounds of the graph
    xMinJacobi = -1.0
    xMaxJacobi = 1.0

    # Get the curves
    for i in range(degreeMax):
        graphJacobi_temp = factory.build(i).draw(xMinJacobi, xMaxJacobi, pointNumber)
        graphJacobi_temp_draw = graphJacobi_temp.getDrawable(0)
        graphJacobi_temp_draw.setLegend("degree " + str(i))
        graphJacobi_temp_draw.setColor(colorList[i])
        graphJacobi.add(graphJacobi_temp_draw)
    return graphJacobi
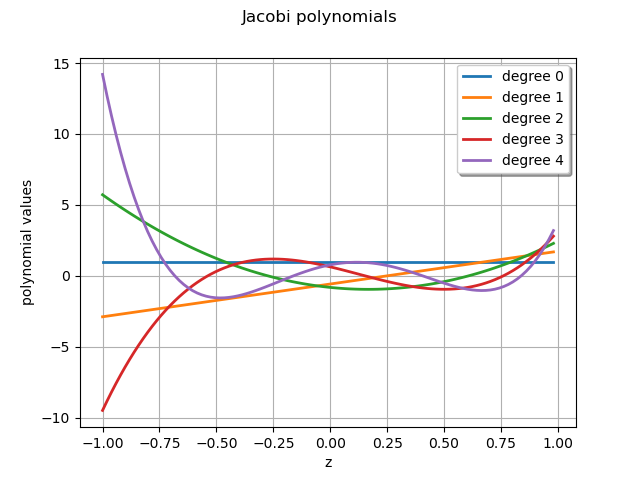
Draw the 5-th first members of the Jacobi family.
Create the Jacobi polynomials family using the default Jacobi.ANALYSIS parameter set
alpha = 0.5
beta = 1.5
jacobiFamily = ot.JacobiFactory(alpha, beta)
graph = drawFamily(jacobiFamily)
view = viewer.View(graph)
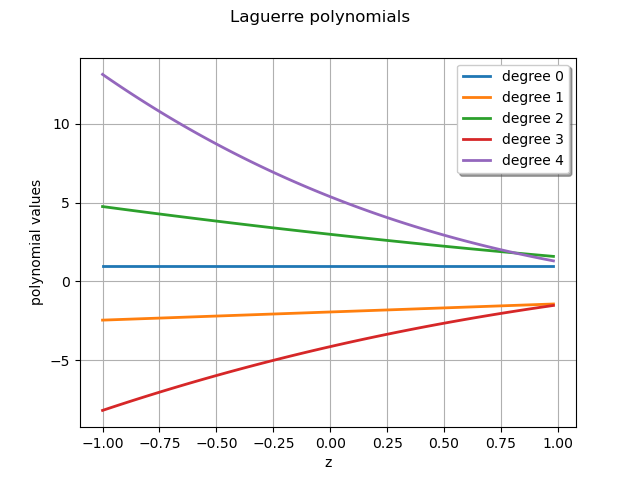
laguerreFamily = ot.LaguerreFactory(2.75, 1)
graph = drawFamily(laguerreFamily)
view = viewer.View(graph)
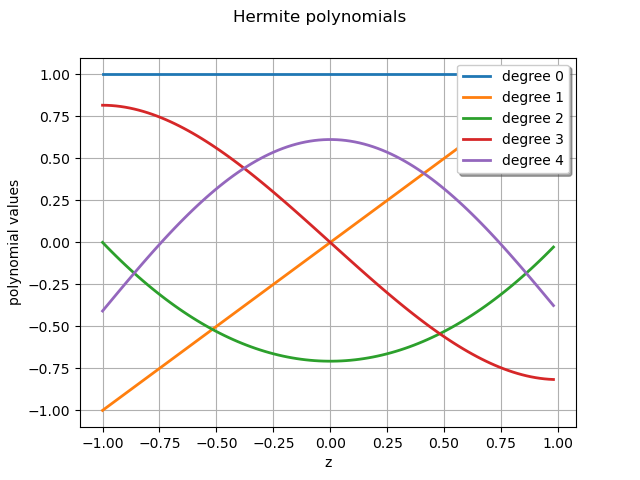
graph = drawFamily(ot.HermiteFactory())
view = viewer.View(graph)
plt.show()