Note
Go to the end to download the full example code.
Create a Bayes distribution
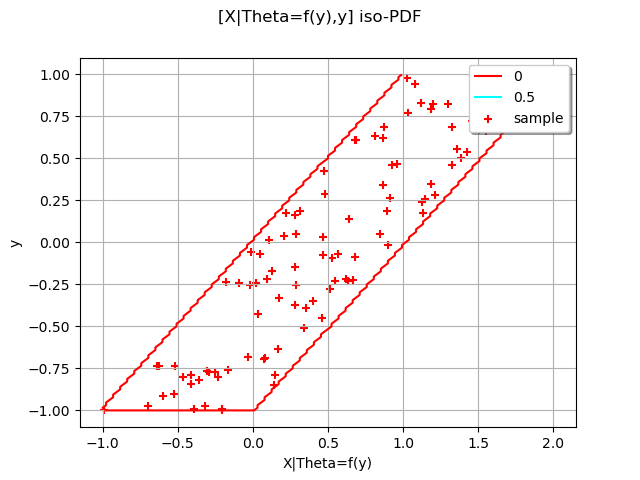
In this example we are going to build the distribution of the random vector

with  conditioned by the random vector
  obtained with the random variable
  through a function

import openturns as ot
import openturns.viewer as viewer
from matplotlib import pylab as plt

ot.Log.Show(ot.Log.NONE)
Create the distribution
YDist = ot.Normal(0.0, 1.0)
Create 
f = ot.SymbolicFunction(["y"], ["y", "0.1 + y^2"])
Create the  distribution
XgivenThetaDist = ot.Normal()
create the distribution
XDist = ot.JointByConditioningDistribution(XgivenThetaDist, YDist, f)
XDist.setDescription(["X|Theta=f(y)", "y"])
XDist
Get a sample
sample = XDist.getSample(100)
Draw PDF
graph = XDist.drawPDF()
cloud = ot.Cloud(sample)
cloud.setColor("red")
cloud.setLegend("sample")
graph.add(cloud)
view = viewer.View(graph)
plt.show()