Correlation analysis on samples
In this example we are going to estimate the correlation between an output sample Y and the corresponding inputs using various estimators:
Pearson coefficients
Spearman coefficients
PCC: Partial Correlation Coefficients
PRCC: Partial Rank Correlation Coefficient
SRC: Standard Regression Coefficients
SRRC: Standard Rank Regression Coefficient
[1]:
from __future__ import print_function
import openturns as ot
To illustrate the usage of the method mentionned above, we define a set of X/Y data using the ususal Ishigami use-case.
[2]:
# Create X/Y data
ot.RandomGenerator.SetSeed(0)
formula = ['X3+sin(pi_*X1)+7*sin(X2)*sin(pi_*X2)+' + \
           '1.2*((pi_*X3)*(pi_*X2))*sin(pi_*X1)']
input_names = ['X1', 'X2', 'X3']
model = ot.SymbolicFunction(input_names, formula)
distribution = ot.ComposedDistribution([ot.Uniform(-1.0, 1.0)] * 3, \
                                        ot.IndependentCopula(3))
size = 100
inputDesign = ot.SobolIndicesExperiment(distribution, size, True).generate()
outputDesign = model(inputDesign)
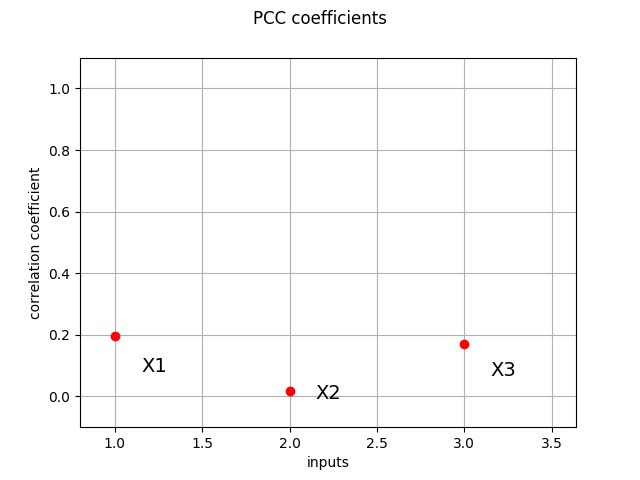
PCC coefficients
We compute here PCC coefficients using the CorrelationAnalysis
[3]:
pcc_indices = ot.CorrelationAnalysis.PCC(inputDesign, outputDesign)
print(pcc_indices)
[0.195052,0.0183082,0.171376]
[4]:
ot.SobolIndicesAlgorithm.DrawCorrelationCoefficients(pcc_indices, input_names, "PCC coefficients")
[4]:
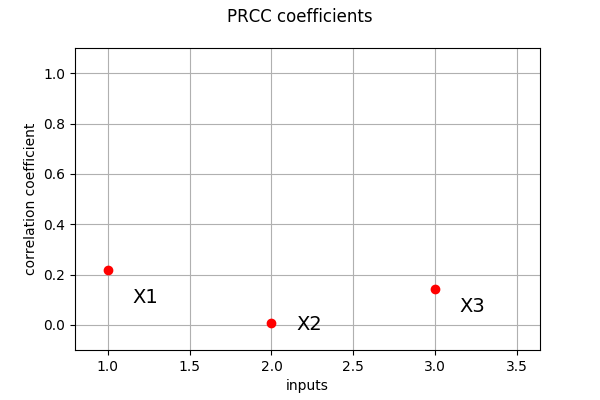
PRCC coefficients
We compute here PRCC coefficients using the CorrelationAnalysis
[5]:
prcc_indices = ot.CorrelationAnalysis.PRCC(inputDesign, outputDesign)
print(prcc_indices)
[0.218657,0.00540221,0.14355]
[6]:
ot.SobolIndicesAlgorithm.DrawCorrelationCoefficients(prcc_indices, input_names, "PRCC coefficients")
[6]:
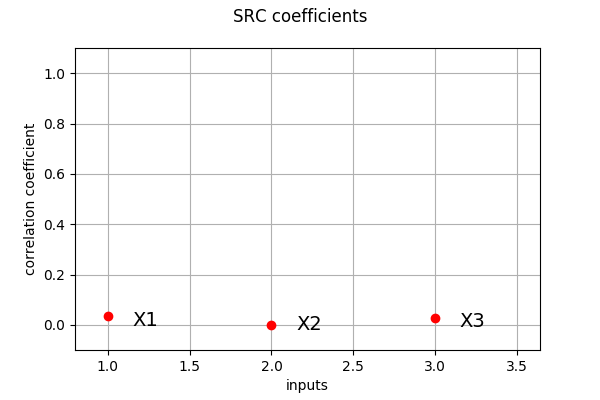
SRC coefficients
We compute here SRC coefficients using the CorrelationAnalysis
[7]:
src_indices = ot.CorrelationAnalysis.SRC(inputDesign, outputDesign)
print(src_indices)
[0.0369391,0.000313641,0.0282987]
[8]:
ot.SobolIndicesAlgorithm.DrawCorrelationCoefficients(src_indices, input_names, 'SRC coefficients')
[8]:
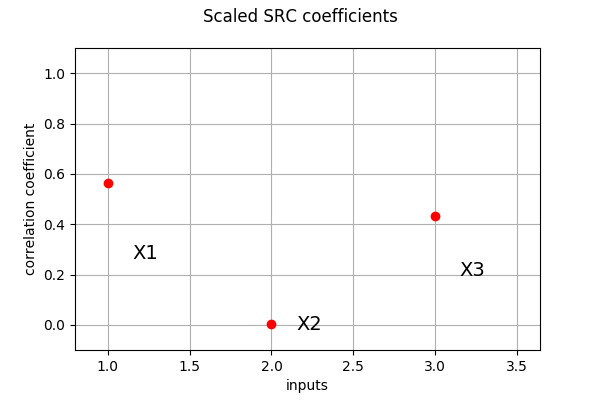
Case where coefficients sum to 1 :
[9]:
scale_src_indices = ot.CorrelationAnalysis.SRC(inputDesign, outputDesign, True)
print(scale_src_indices)
[0.563513,0.00478466,0.431703]
And its associated graph:
[10]:
ot.SobolIndicesAlgorithm.DrawCorrelationCoefficients(scale_src_indices, input_names, 'Scaled SRC coefficients')
[10]:
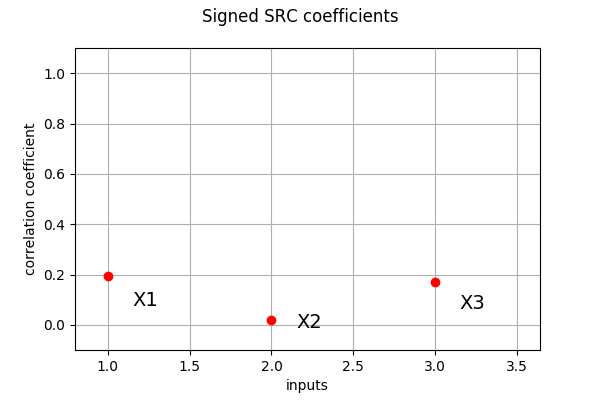
Finally, using signed src: we get the trend importance :
[11]:
signed_src_indices = ot.CorrelationAnalysis.SignedSRC(inputDesign, outputDesign)
print(signed_src_indices)
[0.192195,0.0177099,0.168222]
and its graph :
[12]:
ot.SobolIndicesAlgorithm.DrawCorrelationCoefficients(signed_src_indices, input_names, 'Signed SRC coefficients')
[12]:
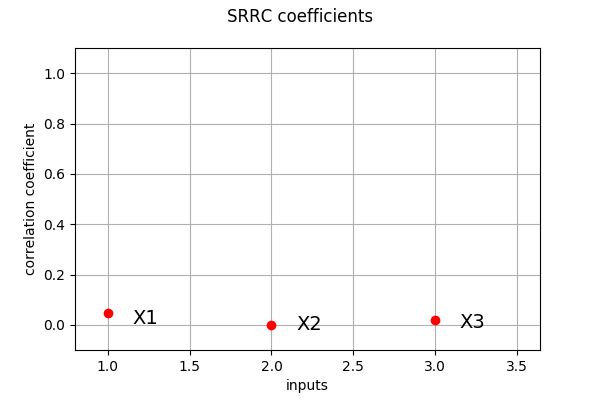
SRRC coefficients
We compute here SRRC coefficients using the CorrelationAnalysis
[13]:
srrc_indices = ot.CorrelationAnalysis.SRRC(inputDesign, outputDesign)
print(srrc_indices)
[0.0468524,2.72779e-05,0.0196627]
[14]:
ot.SobolIndicesAlgorithm.DrawCorrelationCoefficients(srrc_indices, input_names, 'SRRC coefficients')
[14]:
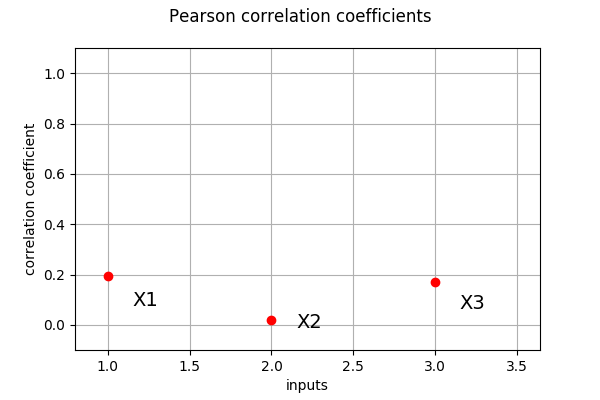
Pearson coefficients
We compute here the Pearson  coefficients using the
 CorrelationAnalysis
[15]:
pearson_correlation = ot.CorrelationAnalysis.PearsonCorrelation(inputDesign, outputDesign)
print(pearson_correlation)
[0.194078,0.0210564,0.171476]
[16]:
ot.SobolIndicesAlgorithm.DrawCorrelationCoefficients(pearson_correlation,
                                                     input_names,
                                                     "Pearson correlation coefficients")
[16]:
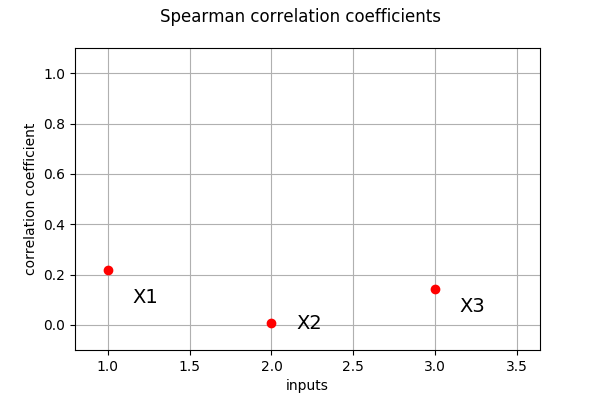
Spearman coefficients
We compute here the Pearson  coefficients using the
 CorrelationAnalysis
[17]:
spearman_correlation = ot.CorrelationAnalysis.SpearmanCorrelation(inputDesign, outputDesign)
print(spearman_correlation)
[0.218318,0.00733303,0.143473]
[18]:
ot.SobolIndicesAlgorithm.DrawCorrelationCoefficients(spearman_correlation,
                                                     input_names,
                                                     "Spearman correlation coefficients")
[18]: