Visualize empirical CDF
In this example we are going to draw the empirical CDF of an unidimensional sample.
[1]:
from __future__ import print_function
import openturns as ot
Then create a sample from a gaussian distribution.
[2]:
size = 100
normal = ot.Normal(1)
sample = normal.getSample(size)
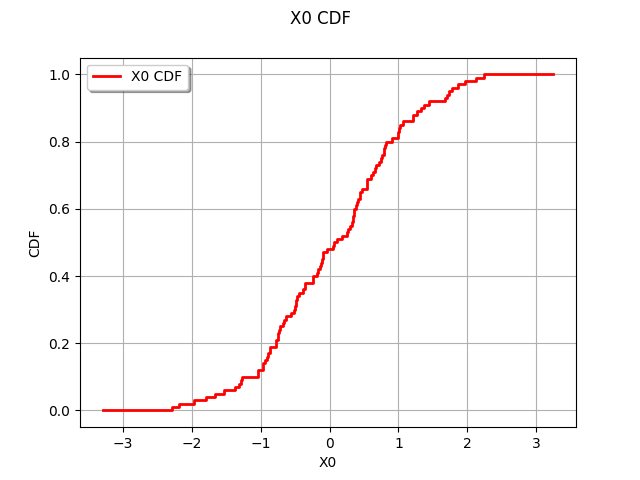
We draw the empirical CDF based on the UserDefined distribution. By default, the drawCDF method requires no input argument.
[3]:
distribution = ot.UserDefined(sample)
distribution.drawCDF()
[3]:
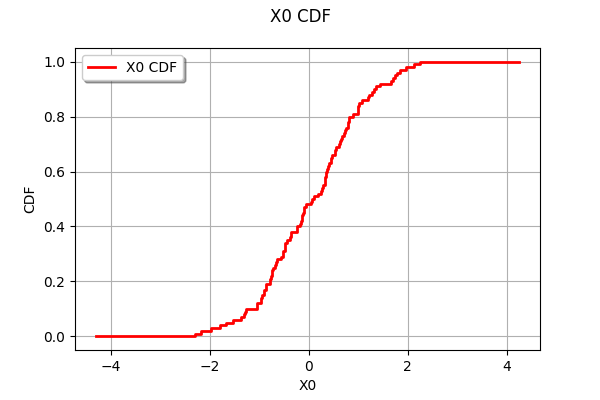
If required, we can specify the interval that we want to draw. In the following example, these bounds are computed from the minimum and the maximum of the sample.
[4]:
xmin = sample.getMin()[0] - 2.0
xmax = sample.getMax()[0] + 2.0
ot.UserDefined(sample).drawCDF(xmin, xmax)
[4]: