Define a connection function with a field output
In this example, we define a function which has a vector input and a field output. The goal of this example is to show how to use the PointToFieldConnection to combine two functions.
Define the model
[1]:
from __future__ import print_function
import openturns as ot
import numpy as np
We first define the time grid associated with the model.
[2]:
tmin=0.0 # Minimum time
tmax=12. # Maximum time
gridsize=100 # Number of time steps
mesh = ot.IntervalMesher([gridsize-1]).build(ot.Interval(tmin, tmax))
[3]:
vertices = mesh.getVertices()
Creation of the input distribution.
[4]:
distZ0 = ot.Uniform(100.0, 150.0)
distV0 = ot.Normal(55.0, 10.0)
distM = ot.Normal(80.0, 8.0)
distC = ot.Uniform(0.0, 30.0)
distribution = ot.ComposedDistribution([distZ0, distV0, distM, distC])
[5]:
dimension = distribution.getDimension()
dimension
[5]:
4
Then we define the Python function which computes the altitude at each time value. This function has 5 inputs: z0, v0, m, c and zmin.
[6]:
def AltiFunc(X):
    g  = 9.81
    z0 = X[0]
    v0 = X[1]
    m  = X[2]
    c  = X[3]
    zmin  = X[4]
    tau = m / c
    vinf = - m * g / c
    t = np.array(vertices)
    z = z0 + vinf * t + tau * (v0 - vinf) * (1 - np.exp( - t / tau))
    z = np.maximum(z,zmin)
    return [[zeta[0]] for zeta in z]
[7]:
outputDimension = 1
altitudeWithFiveInputs = ot.PythonPointToFieldFunction(5, mesh, outputDimension, AltiFunc)
Restrict the number of inputs
We define a function which has 4 inputs and 5 outputs: the 5th ouput zmin is set to zero.
[8]:
projectionFunction = ot.SymbolicFunction(["z0", "v0", "m", "c"], ["z0", "v0", "m", "c", "0.0"])
Then we use the PointToFieldConnection to create a function which has 4 inputs and returns the output field.
[9]:
altitudeWithFourInputs = ot.PointToFieldConnection(altitudeWithFiveInputs, projectionFunction)
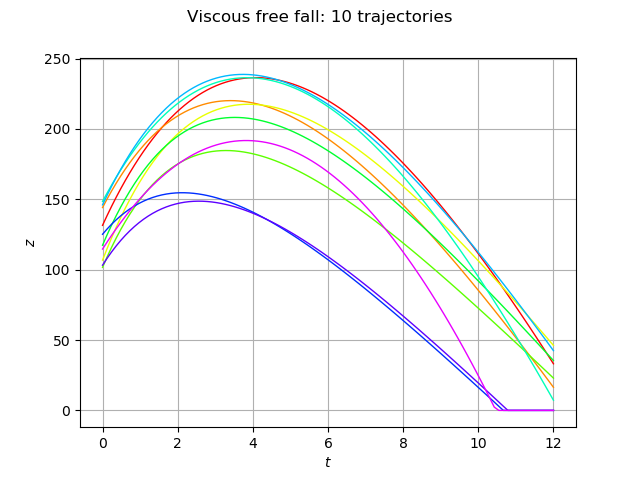
Sample trajectories
In order to sample trajectories, we use the getSample method of the input distribution and apply the field function.
[10]:
size = 10
inputSample = distribution.getSample(size)
outputSample = altitudeWithFourInputs(inputSample)
Draw some curves.
[11]:
graph = outputSample.drawMarginal(0)
graph.setTitle('Viscous free fall: %d trajectories' % (size))
graph.setXTitle(r'$t$')
graph.setYTitle(r'$z$')
graph
[11]: