Note
Click here to download the full example code
Visualize clouds
In this example we are going to draw clouds of points from a data sample.
from __future__ import print_function
import openturns as ot
import openturns.viewer as viewer
from matplotlib import pylab as plt
ot.Log.Show(ot.Log.NONE)
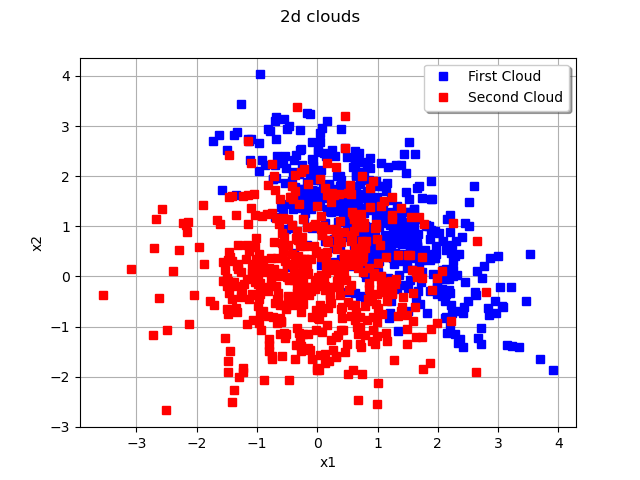
Create 2-d samples to visualize
N = 500
R = ot.CorrelationMatrix(2)
R[0,1] = -0.7
sample1 = ot.Normal([1.0]*2, [1.0]*2, R).getSample(N) # 2d N(1,1) with correlation
sample2 = ot.Normal(2).getSample(N) # 2d N(0,1) independent
Create cloud drawables
cloud1 = ot.Cloud(sample1, 'blue', 'fsquare', 'First Cloud')
cloud2 = ot.Cloud(sample2, 'red', 'fsquare', 'Second Cloud')

# Then, assemble it into a graph
myGraph2d = ot.Graph('2d clouds', 'x1', 'x2', True, 'topright')
myGraph2d.add(cloud1)
myGraph2d.add(cloud2)
view = viewer.View(myGraph2d)
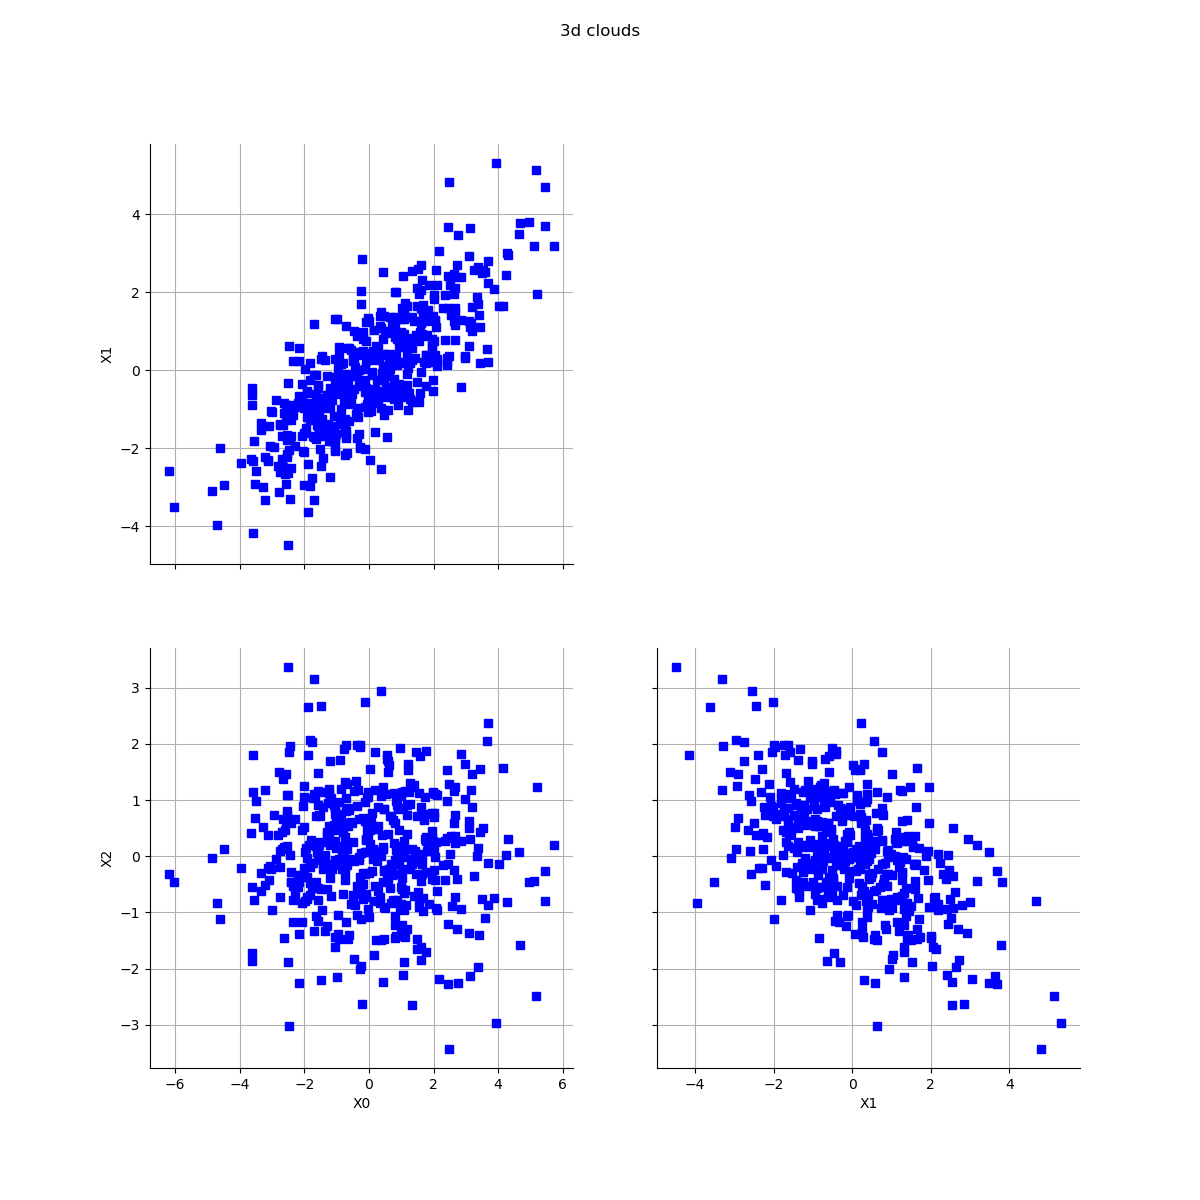
Create a 3-d sample
mean = [0.0] * 3
sigma = [2.0, 1.5, 1.0]
R = ot.CorrelationMatrix(3)
R[0, 1] = 0.8
R[1, 2] = -0.5
N = 500
sample3 = ot.Normal(mean, sigma, R).getSample(N)
Draw clouds pairs
graph3 = ot.VisualTest.DrawPairs(sample3)
graph3.setTitle('3d clouds')
view = viewer.View(graph3)
plt.show()
Total running time of the script: ( 0 minutes 0.282 seconds)