Note
Click here to download the full example code
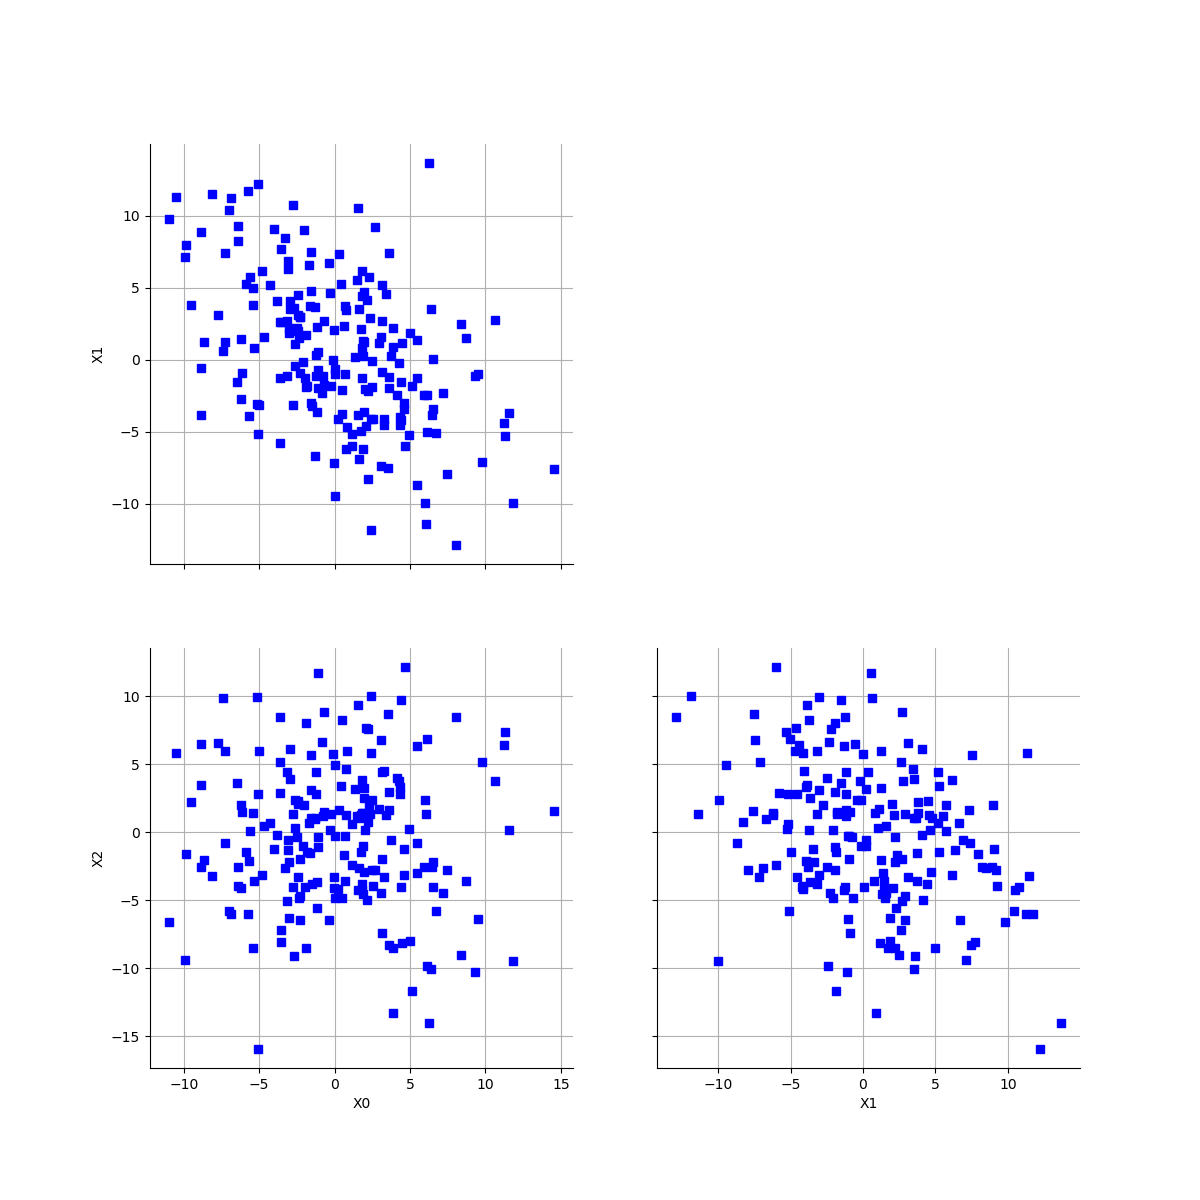
Visualize pairs
In this example we are going to a visualize a multidimensional sample by drawing each pair of 2-d marginal clouds.
from __future__ import print_function
import openturns as ot
import openturns.viewer as viewer
from matplotlib import pylab as plt
ot.Log.Show(ot.Log.NONE)
Create data to visualize
R = ot.CorrelationMatrix(3)
for i in range(1, 3):
    R[i, i - 1] = -0.4
distribution = ot.Normal([0.] * 3, [5.] * 3, R)
sample = distribution.getSample(200)
Create cloud pairs graphs
graph = ot.Graph("Cloud pairs graph", " ", " ", True, "")
graph = ot.VisualTest.DrawPairs(sample)
view = viewer.View(graph)
plt.show()
Total running time of the script: ( 0 minutes 0.183 seconds)