Note
Click here to download the full example code
Normal fitting test using the Henry line
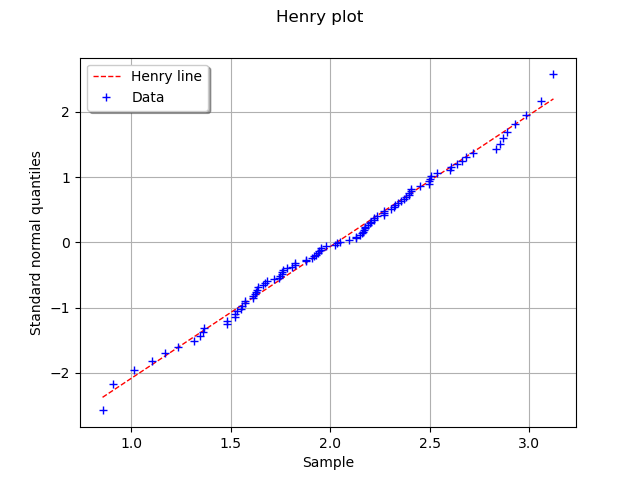
In this example we are going to perform a visual goodness-of-fit test for an univariate normal distribution using the Henry line test, which is the QQ plot adapted for Gaussian distirbutions.
from __future__ import print_function
import openturns as ot
import openturns.viewer as viewer
from matplotlib import pylab as plt
ot.Log.Show(ot.Log.NONE)
Create data
ot.RandomGenerator.SetSeed(0)
distribution = ot.Normal(2.0, 0.5)
sample1 = distribution.getSample(100)
Draw Henry line plot (good)
graph = ot.VisualTest_DrawHenryLine(sample1)
view = viewer.View(graph)
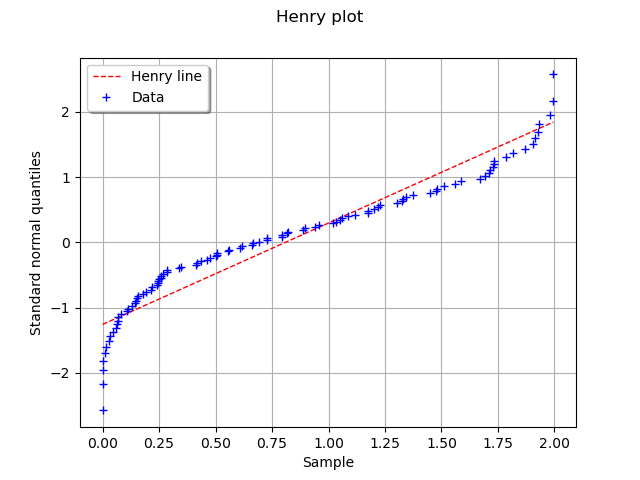
Draw Henry line plot for a Beta (bad)
sample2 = ot.Beta(0.7, 0.9, 0.0, 2.0).getSample(100)
graph = ot.VisualTest_DrawHenryLine(sample2)
view = viewer.View(graph)
plt.show()
Total running time of the script: ( 0 minutes 0.156 seconds)