Note
Click here to download the full example code
Field manipulation
The objective here is to create and manipulate a field. A field is the agregation of a mesh  of a domain
  and a sample of values in
  associated to each vertex of the mesh.
We note  the vertices of and
  the associated values in .
A field is stored in the Field object that stores the mesh and the values at each vertex of the mesh. It can be built from a mesh and values or as a realization of a stochastic process.
from __future__ import print_function
import openturns as ot
import openturns.viewer as viewer
from matplotlib import pylab as plt
import math as m
ot.Log.Show(ot.Log.NONE)
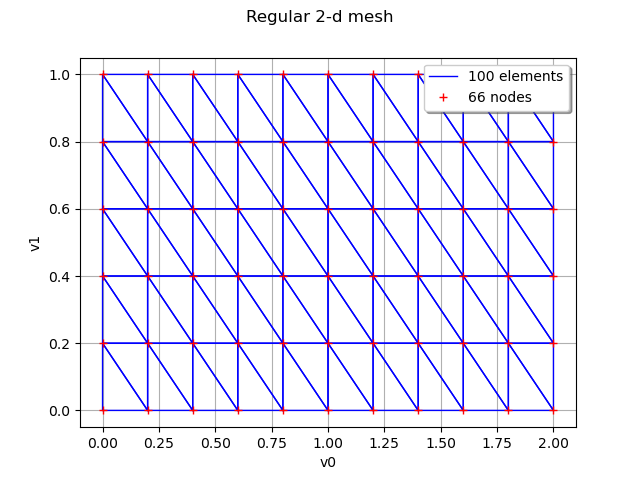
First, define a regular 2-d mesh
discretization = [10, 5]
mesher = ot.IntervalMesher(discretization)
lowerBound = [0.0, 0.0]
upperBound = [2.0, 1.0]
interval = ot.Interval(lowerBound, upperBound)
mesh = mesher.build(interval)
graph = mesh.draw()
graph.setTitle('Regular 2-d mesh')
view = viewer.View(graph)
Create a field as a realization of a process
amplitude = [1.0]
scale = [0.2]*2
myCovModel = ot.ExponentialModel(scale, amplitude)
myProcess = ot.GaussianProcess(myCovModel, mesh)
field = myProcess.getRealization()
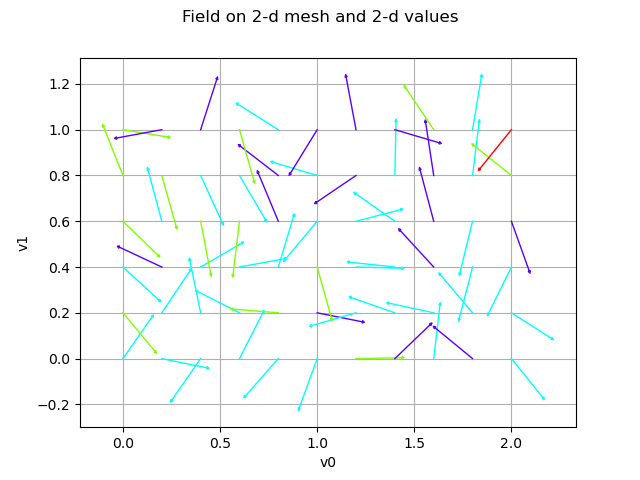
Create a field from a mesh and some values
values = ot.Normal([0.0]*2, [1.0]*2, ot.CorrelationMatrix(2)).getSample(len(mesh.getVertices()))
for i in range(len(values)):
    x = values[i]
    values[i] = 0.05 * x / x.norm()
field = ot.Field(mesh, values)
graph = field.draw()
graph.setTitle('Field on 2-d mesh and 2-d values')
view = viewer.View(graph)
Compute the input mean of the field
field.getInputMean()
[-0.00840808,0.00576205]
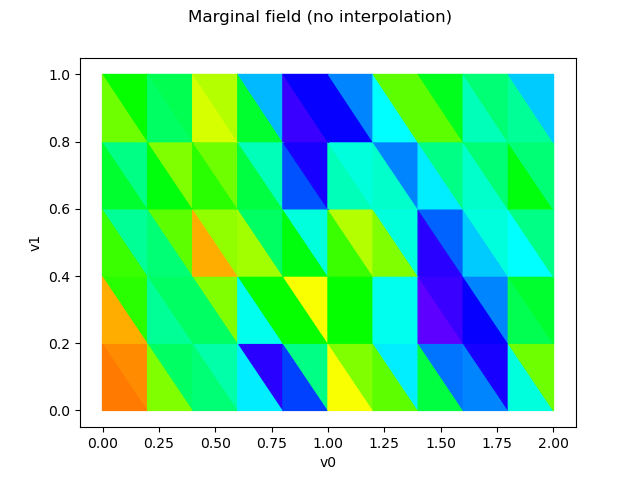
Draw the field without interpolation
graph = field.drawMarginal(0, False)
graph.setTitle('Marginal field (no interpolation)')
view = viewer.View(graph)
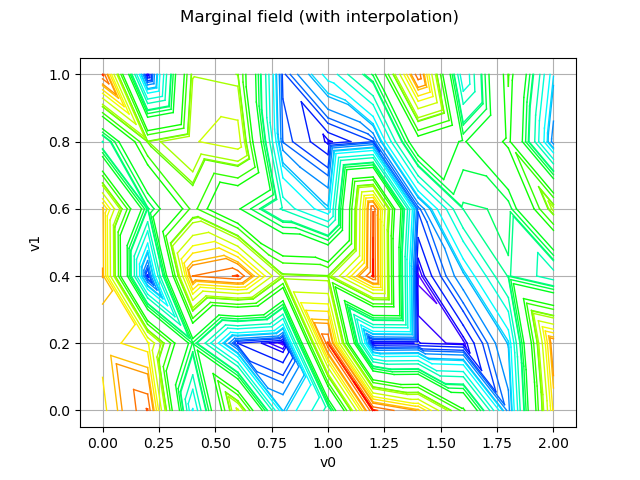
Draw the field with interpolation
graph = field.drawMarginal(0)
graph.setTitle('Marginal field (with interpolation)')
view = viewer.View(graph)
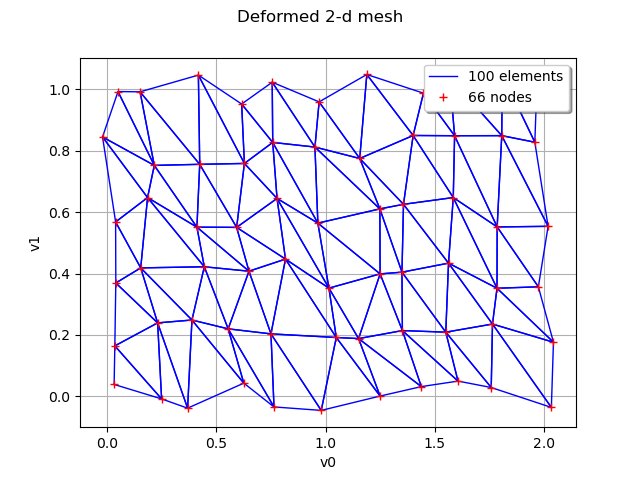
Deform the mesh from the field according to the values of the field The dimension of the mesh (ie of its vertices) must be the same as the dimension of the field (ie its values)
graph = field.asDeformedMesh().draw()
graph.setTitle('Deformed 2-d mesh')
view = viewer.View(graph)
Export to the VTK format
field.exportToVTKFile('field.vtk')
with open('field.vtk') as f:
    print(f.read()[:100])

plt.show()
Out:
# vtk DataFile Version 3.0
Unnamed
ASCII

DATASET UNSTRUCTURED_GRID
POINTS 66 float
0 0 0.0
0.2 0 0.
Total running time of the script: ( 0 minutes 1.774 seconds)