Note
Click here to download the full example code
Create a gaussian process from spectral density
In this example we are going to build a gaussian process from its spectral density.
from __future__ import print_function
import openturns as ot
import openturns.viewer as viewer
from matplotlib import pylab as plt
ot.Log.Show(ot.Log.NONE)
define a spectral model
amplitude = [1.0, 2.0]
scale = [4.0, 5.0]
spatialCorrelation = ot.CorrelationMatrix(2)
spatialCorrelation[0,1] = 0.8
mySpectralModel = ot.CauchyModel(scale, amplitude, spatialCorrelation)
define a mesh
myTimeGrid = ot.RegularGrid(0.0, 0.1, 20)
create the process
process = ot.SpectralGaussianProcess(mySpectralModel, myTimeGrid)
print(process)
Out:
 SpectralGaussianProcess=SpectralGaussianProcess dimension=2 spectralModel=class=CauchyModel amplitude=[1,2] scale=[4,5] spatial correlation=
[[ 1   0.8 ]
 [ 0.8 1   ]] maximal frequency=5 n frequency=10
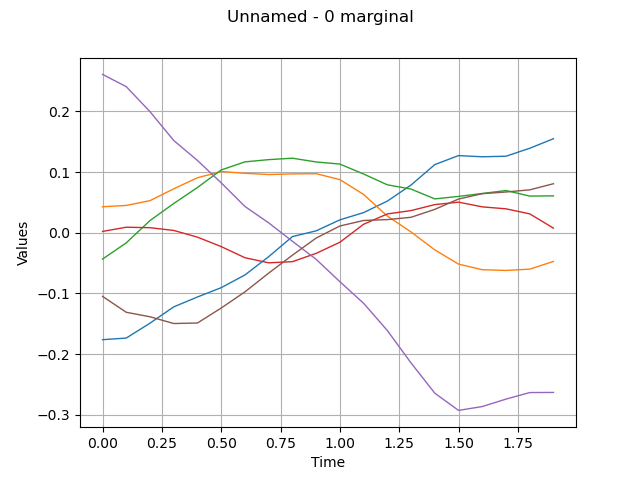
draw a sample
sample = process.getSample(6)
graph = sample.drawMarginal(0)
view = viewer.View(graph)
plt.show()
Total running time of the script: ( 0 minutes 0.077 seconds)