Note
Click here to download the full example code
Test Normality
Normal fitting test using the Henry line
In this paragraph we perform a visual goodness-of-fit test for a univariate normal distribution using the Henry line test, which is the QQ plot adapted for Gaussian distributions.
import openturns as ot
import openturns.viewer as viewer
from matplotlib import pylab as plt
ot.Log.Show(ot.Log.NONE)
We first create the data :
distribution = ot.Normal(2.0, 0.5)
sample1 = distribution.getSample(100)
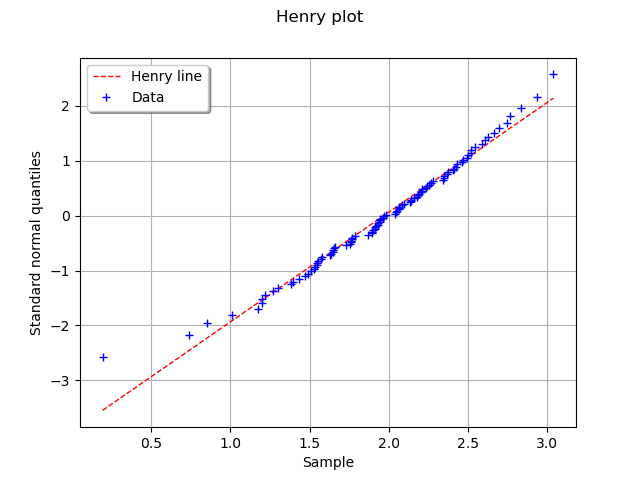
We draw the Henry line plot and expect a good fitting :
graph = ot.VisualTest.DrawHenryLine(sample1)
view = viewer.View(graph)

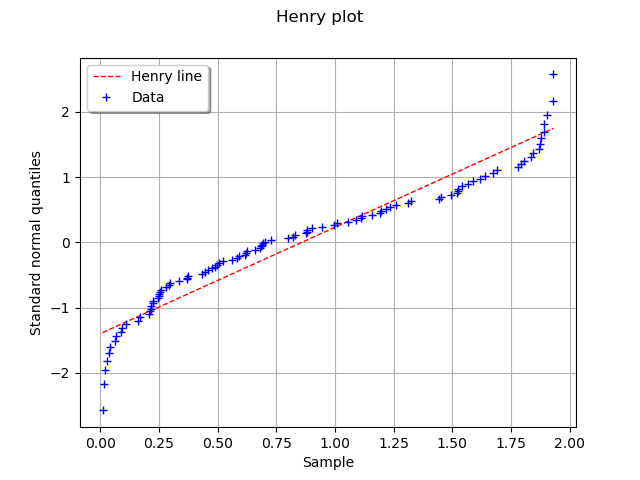
For comparison sake e draw the Henry line plot for a Beta distribution. The result is expected to be bad.
sample2 = ot.Beta(0.7, 0.9, 0.0, 2.0).getSample(100)
graph = ot.VisualTest.DrawHenryLine(sample2)
view = viewer.View(graph)

Normality tests
We use two tests to check whether a sample follows a normal distribution :
the Anderson-Darling test
the Cramer-Von Mises test
We first generate two samples, one from a standard unit gaussian and another from a Gumbel
distribution with parameters and
.
sample1 = ot.Normal().getSample(200)
sample2 = ot.Gumbel().getSample(200)
We test the normality of the sample. We can display the result of the test as a yes/no answer with the getBinaryQualityMeasure. We can retrieve the p-value and the threshold with the getPValue and getThreshold methods.
test_result = ot.NormalityTest.AndersonDarlingNormal(sample1)
print('Component is normal?', test_result.getBinaryQualityMeasure(),
      'p-value=%.6g' % test_result.getPValue(),
      'threshold=%.6g' % test_result.getThreshold())
Out:
Component is normal? False p-value=0.021519 threshold=0.05
test_result = ot.NormalityTest.AndersonDarlingNormal(sample2)
print('Component is normal?', test_result.getBinaryQualityMeasure(),
      'p-value=%.6g' % test_result.getPValue(),
      'threshold=%.6g' % test_result.getThreshold())
Out:
Component is normal? False p-value=1.45169e-10 threshold=0.05
test_result = ot.NormalityTest.CramerVonMisesNormal(sample1)
print('Component is normal?', test_result.getBinaryQualityMeasure(),
      'p-value=%.6g' % test_result.getPValue(),
      'threshold=%.6g' % test_result.getThreshold())
Out:
Component is normal? False p-value=0.0438816 threshold=0.05
test_result = ot.NormalityTest.CramerVonMisesNormal(sample2)
print('Component is normal?', test_result.getBinaryQualityMeasure(),
      'p-value=%.6g' % test_result.getPValue(),
      'threshold=%.6g' % test_result.getThreshold())
Out:
Component is normal? False p-value=4.33705e-08 threshold=0.05
Total running time of the script: ( 0 minutes 0.151 seconds)
 OpenTURNS