Note
Click here to download the full example code
Multi-objective optimization using Pagmo
In this example we are going to explore optimization using the Pagmo solver.
import openturns as ot
from openturns.viewer import View

ot.Log.Show(ot.Log.NONE)
ot.RandomGenerator.SetSeed(0)
List available algorithms
for algo in ot.Pagmo.GetAlgorithmNames():
    print(algo)
Out:
gaco
de
sade
de1220
gwo
ihs
pso
pso_gen
sea
sga
simulated_annealing
bee_colony
cmaes
xnes
nsga2
moead
mhaco
nspso
More details on Pagmo algorithms are available here .
Create the problem, from ZDT test suite
f = ot.SymbolicFunction(
    ['x1', 'x2'], ['x1', 'var g := 1.0 + 9.0 * (x1 + x2); g * (1.0 - sqrt(x1 / g))'])
zdt1 = ot.OptimizationProblem(f)
zdt1.setBounds(ot.Interval([0.0] * 2, [1.0] * 2))
We create the first generation of points by sampling into the bounding box
pop0 = ot.ComposedDistribution([ot.Uniform(0.0, 1.0)] * 2).getSample(100)
We create the algorithm that should evolve over 180 generations
algo = ot.Pagmo(zdt1, 'nsga2', pop0)
algo.setGenerationNumber(180)
Benefit from parallel evaluations if the function allows it
algo.setBlockSize(8)
We run the algo
algo.run()
pop1 = algo.getResult().getFinalPoints()
We list the available Pareto fronts
fronts = algo.getResult().getParetoFrontsIndices()
len(fronts)
Out:
18
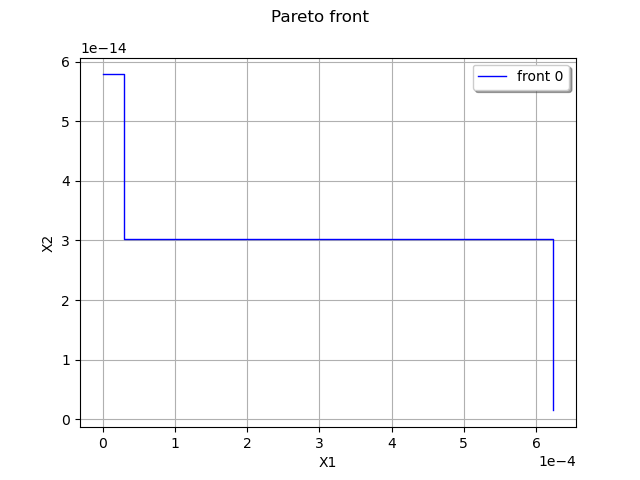
We show the Pareto front
graph = ot.Graph("Pareto front", "X1", "X2", True, 'topright')
front = algo.getResult().getFinalPoints().select(
    fronts[0]).sortAccordingToAComponent(0)
data = ot.Sample(2*front.getSize()-1, 2)
for i in range(front.getSize()):
    data[2*i] = front[i]
    if i != front.getSize()-1:
        data[2*i+1, 0] = front[i+1, 0]
        data[2*i+1, 1] = front[i, 1]
curve = ot.Curve(data)
curve.setColor('blue')
curve.setLegend(f"front {0}")
graph.add(curve)
graph.setGrid(True)
View(graph)
Out:
<openturns.viewer.View object at 0x7f73088346d0>
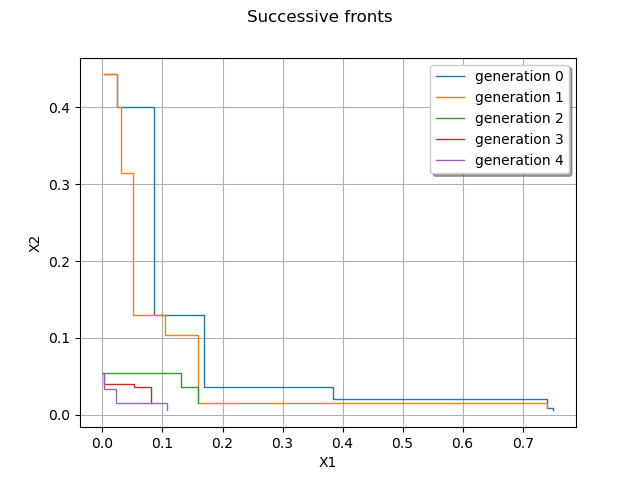
We show the Pareto front from successive generations
fronts = []
for gen in range(5):
    algo = ot.Pagmo(zdt1, 'nsga2', pop0)
    algo.setGenerationNumber(gen)
    algo.run()
    front0 = algo.getResult().getParetoFrontsIndices()[0]
    fronts.append(algo.getResult().getFinalPoints().select(front0))
graph = ot.Graph("Successive fronts", "X1", "X2", True, 'topright')
palette = ot.Drawable.BuildDefaultPalette(len(fronts))
for k in range(len(fronts)):
    front = fronts[k].sortAccordingToAComponent(0)
    print(front)
    data = ot.Sample(2*front.getSize()-1, 2)
    for i in range(front.getSize()):
        data[2*i] = front[i]
        if i != front.getSize()-1:
            data[2*i+1, 0] = front[i+1, 0]
            data[2*i+1, 1] = front[i, 1]
    curve = ot.Curve(data)
    curve.setColor(palette[k])
    curve.setLegend(f"generation {k}")
    graph.add(curve)
graph.setGrid(True)
View(graph)


View.ShowAll()
Out:
    [ v0         v1         ]
0 : [ 0.00210762 0.442878   ]
1 : [ 0.0245595  0.400443   ]
2 : [ 0.085785   0.130402   ]
3 : [ 0.169217   0.0363444  ]
4 : [ 0.383362   0.0199465  ]
5 : [ 0.7411     0.00930063 ]
6 : [ 0.751194   0.00603288 ]
    [ v0         v1         ]
0 : [ 0.00210762 0.442878   ]
1 : [ 0.0245595  0.400443   ]
2 : [ 0.0245595  0.400443   ]
3 : [ 0.0301332  0.314479   ]
4 : [ 0.0509366  0.130402   ]
5 : [ 0.104095   0.103427   ]
6 : [ 0.159386   0.0155397  ]
7 : [ 0.7411     0.00930063 ]
    [ v0         v1         ]
0 : [ 0.00210762 0.0540917  ]
1 : [ 0.130451   0.0367106  ]
2 : [ 0.159386   0.0155397  ]
3 : [ 0.159386   0.0155397  ]
    [ v0          v1          ]
0 : [ 0.000163801 0.0537685   ]
1 : [ 0.00210762  0.040612    ]
2 : [ 0.0529645   0.0363444   ]
3 : [ 0.0805554   0.0155397   ]
    [ v0          v1          ]
0 : [ 0.000163801 0.0537685   ]
1 : [ 0.000163801 0.0537685   ]
2 : [ 0.00210762  0.040612    ]
3 : [ 0.00260066  0.0332253   ]
4 : [ 0.0233772   0.0153673   ]
5 : [ 0.107405    0.00566359  ]
Total running time of the script: ( 0 minutes 0.348 seconds)