Note
Go to the end to download the full example code
Use the Directional Sampling Algorithm
In this example we estimate a failure probability with the directional simulation algorithm provided by the DirectionalSampling class.
Introduction
The directional simulation algorithm operates in the standard space based on:
a root strategy to evaluate the nearest failure point along each direction and take the contribution of each direction to the failure event probability into account. The available strategies are: - RiskyAndFast - MediumSafe - SafeAndSlow
a sampling strategy to choose directions in the standard space. The available strategies are: - RandomDirection - OrthogonalDirection
Let us consider the analytical example of the cantilever beam described here.
from openturns.usecases import cantilever_beam
import openturns as ot
import openturns.viewer as viewer

ot.Log.Show(ot.Log.NONE)
We load the model from the usecases module :
cb = cantilever_beam.CantileverBeam()
We load the joint probability distribution of the input parameters :
distribution = cb.distribution
We load the model giving the displacement at the end of the beam :
model = cb.model
We create the event whose probability we want to estimate.
vect = ot.RandomVector(distribution)
G = ot.CompositeRandomVector(model, vect)
event = ot.ThresholdEvent(G, ot.Greater(), 0.30)
Root finding algorithm.
solver = ot.Brent()
rootStrategy = ot.MediumSafe(solver)
Direction sampling algorithm.
samplingStrategy = ot.OrthogonalDirection()
Create a simulation algorithm.
algo = ot.DirectionalSampling(event, rootStrategy, samplingStrategy)
algo.setMaximumCoefficientOfVariation(0.1)
algo.setMaximumOuterSampling(40000)
algo.setConvergenceStrategy(ot.Full())
algo.run()
Retrieve results.
result = algo.getResult()
probability = result.getProbabilityEstimate()
print("Pf=", probability)
Pf= 4.6231314140367655e-07
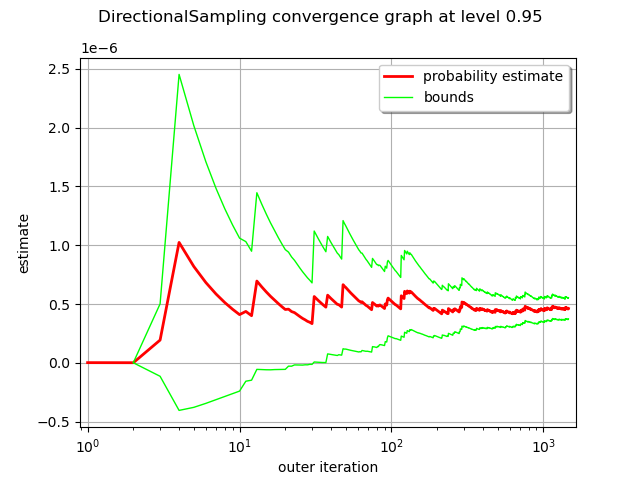
We can observe the convergence history with the drawProbabilityConvergence method.
graph = algo.drawProbabilityConvergence()
graph.setLogScale(ot.GraphImplementation.LOGX)
view = viewer.View(graph)

Total running time of the script: ( 0 minutes 0.740 seconds)
 OpenTURNS