Note
Go to the end to download the full example code.
Cross-cuts of conditional distributions in 2-d
import openturns as ot
import otbenchmark as otb
Create a Funky distribution
corr = ot.CorrelationMatrix(2)
corr[0, 1] = 0.2
copula = ot.NormalCopula(corr)
x1 = ot.Normal(-1.0, 1.0)
x2 = ot.Normal(2.0, 1.0)
x_funk = ot.ComposedDistribution([x1, x2], copula)
Create a Punk distribution
x1 = ot.Normal(1.0, 1.0)
x2 = ot.Normal(-2.0, 1.0)
x_punk = ot.ComposedDistribution([x1, x2], copula)
distribution = ot.Mixture([x_funk, x_punk], [0.5, 1.0])
referencePoint = distribution.getMean()
Plot cross-cuts of the distribution
crossCut = otb.CrossCutDistribution(distribution)
_ = crossCut.drawConditionalPDF(referencePoint)
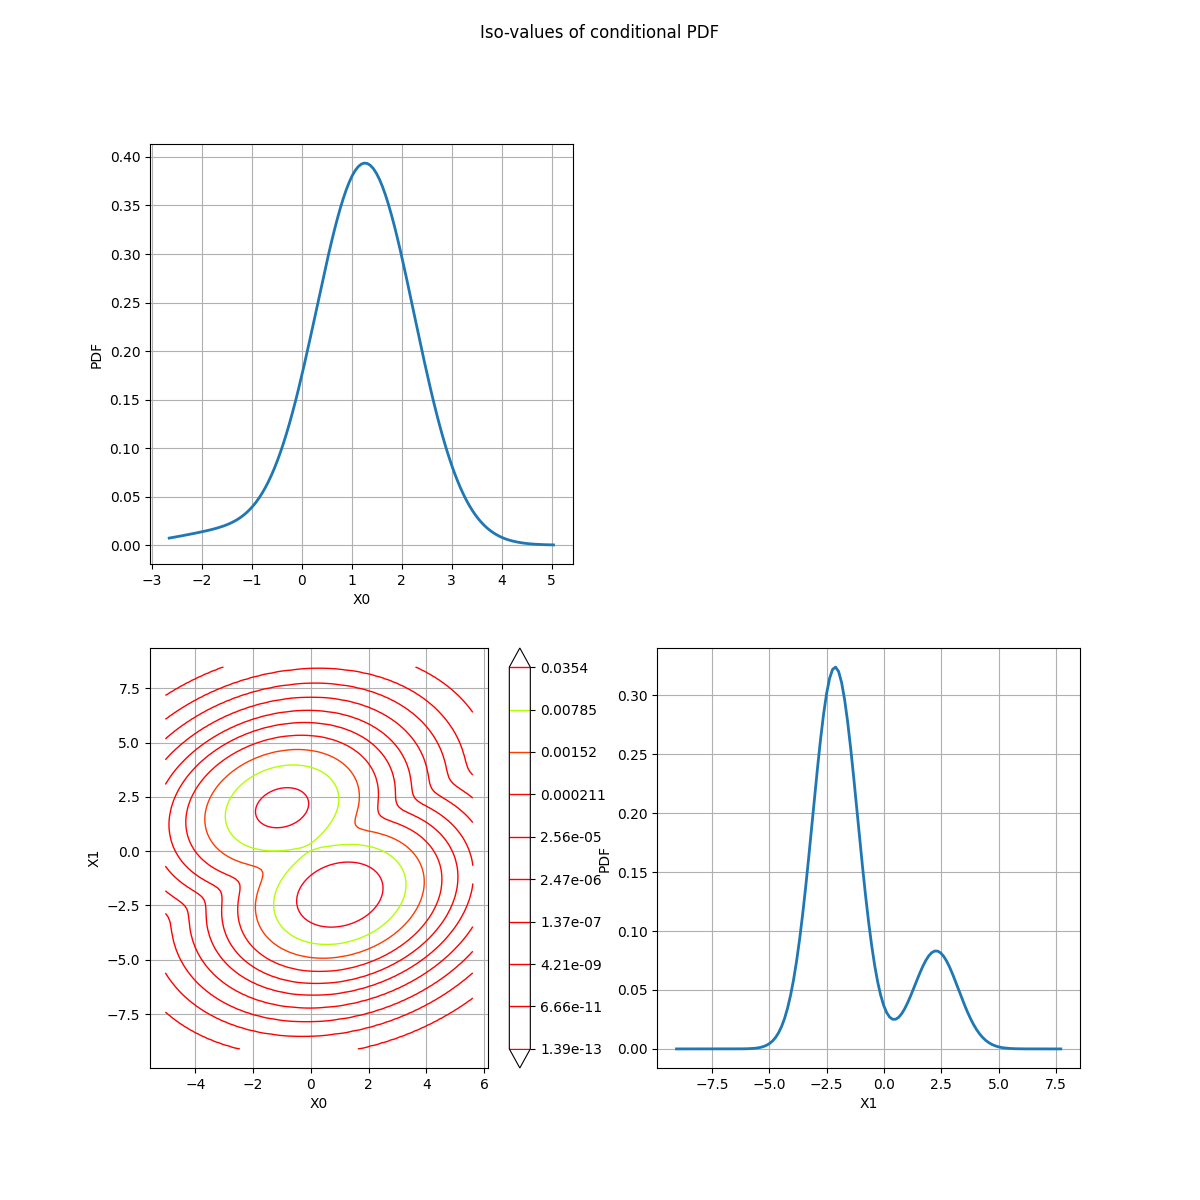
Descr = 1 0
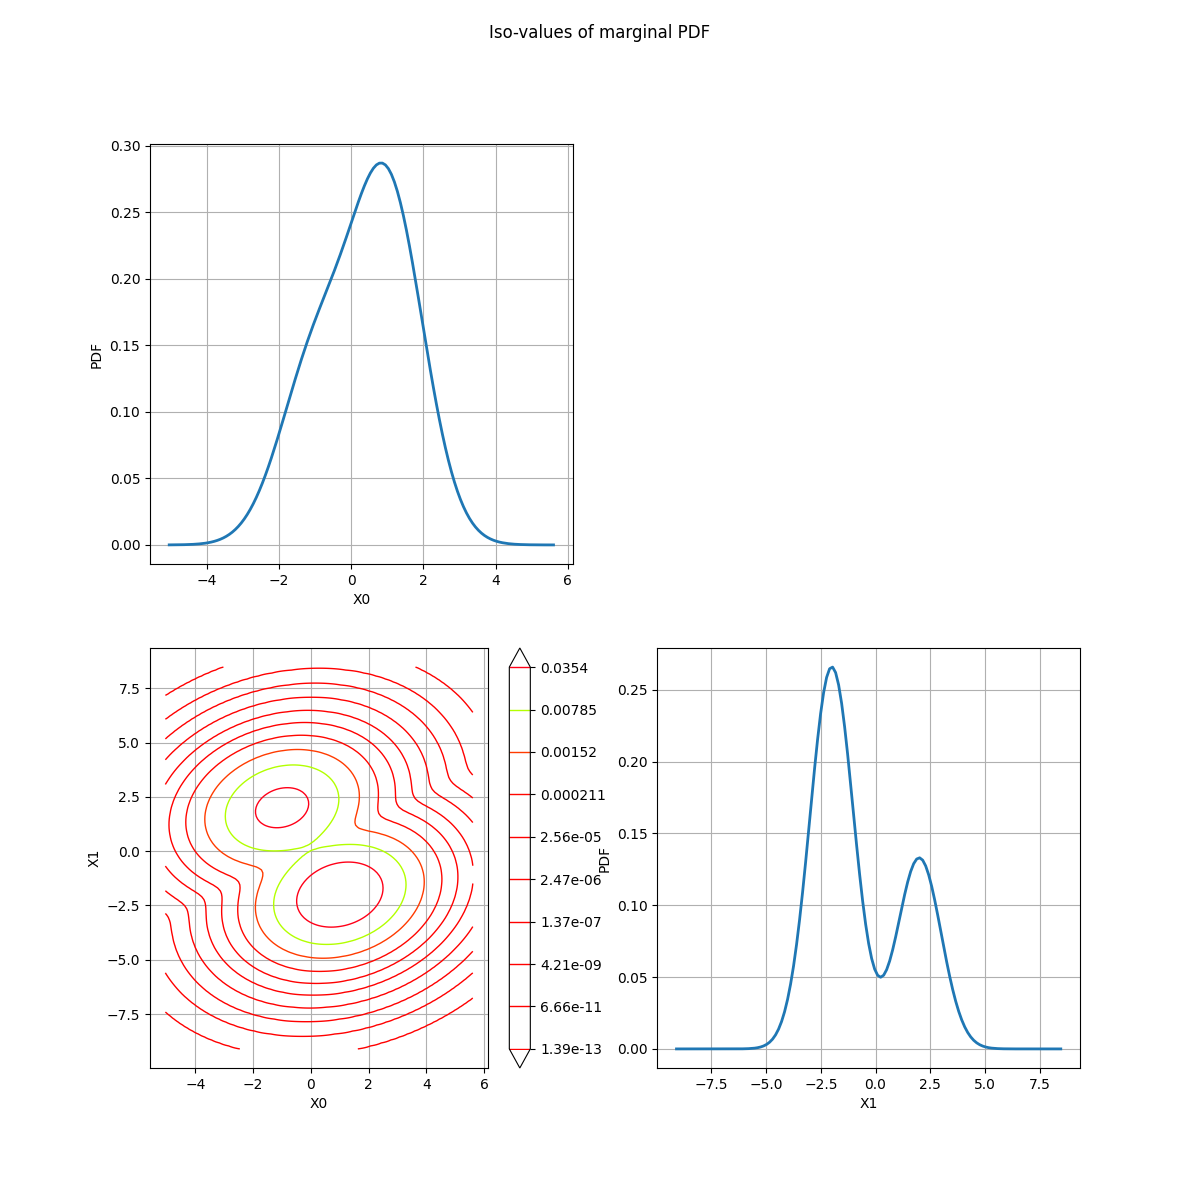
_ = crossCut.drawMarginalPDF()
Total running time of the script: (0 minutes 1.276 seconds)