Note
Go to the end to download the full example code.
Draw cross-cuts of multidimensional functions
This example shows how to represent multidimensional functions. When 2D plots are to draw, contours are used. We use 2D cross-sections to represent multidimensional objects when required, which leads to cross-cuts representations.
import otbenchmark as otb
import openturns.viewer as otv
problem = otb.ReliabilityProblem33()
event = problem.getEvent()
g = event.getFunction()
Compute the bounds of the domain
inputVector = event.getAntecedent()
distribution = inputVector.getDistribution()
inputDimension = distribution.getDimension()
inputDimension
3
alpha = 1 - 1.0e-5
bounds, marginalProb = distribution.computeMinimumVolumeIntervalWithMarginalProbability(
    alpha
)
referencePoint = distribution.getMean()
referencePoint
crossCut = otb.CrossCutFunction(g, referencePoint)
_ = crossCut.draw(bounds)
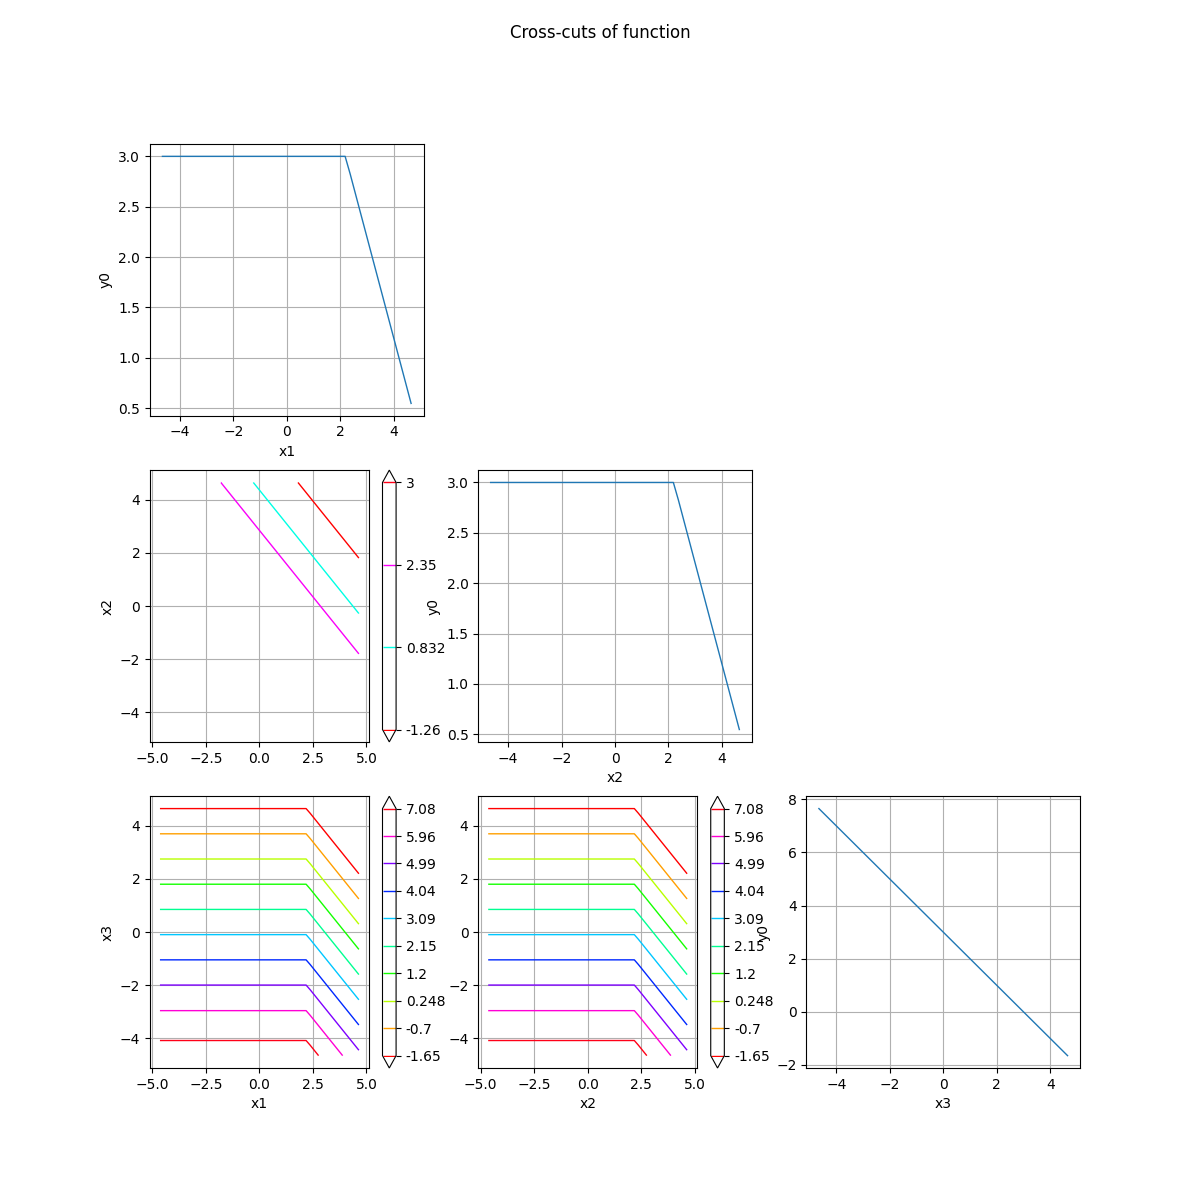
Let us explain this figure in detail, by describing each sub-plot from top to bottom, and from left to right:
Fig. A,
Fig. B, C,
Fig. D, E, F.
Let  be the reference point.
Fig. A : represents
 ,
which is a function depending on
,
which is a function depending on  only.
only.Fig. B : represents the contours of the bi-dimensional function
 which depends on and
  .
.Fig. C : represents
 ,
which is a function depending on only.
,
which is a function depending on only.Fig. D : represents the contours of the bi-dimensional function
 which depends on and
  .
.Fig. E : represents the contours of the bi-dimensional function
 which depends on and .
Fig. F : represents
 ,
which is a function depending on only.
,
which is a function depending on only.
otv.View.ShowAll()
Total running time of the script: (0 minutes 0.737 seconds)