Note
Go to the end to download the full example code.
Demonstration of the DrawEvent class
import otbenchmark as otb
import openturns.viewer as otv
3D problem
problem = otb.ReliabilityProblem33()
event = problem.getEvent()
g = event.getFunction()
inputVector = event.getAntecedent()
distribution = inputVector.getDistribution()
inputDimension = distribution.getDimension()
inputDimension
3
alpha = 1 - 0.00001
bounds, marginalProb = distribution.computeMinimumVolumeIntervalWithMarginalProbability(
    alpha
)
referencePoint = distribution.getMean()
referencePoint
inputVector = event.getAntecedent()
event = problem.getEvent()
g = event.getFunction()
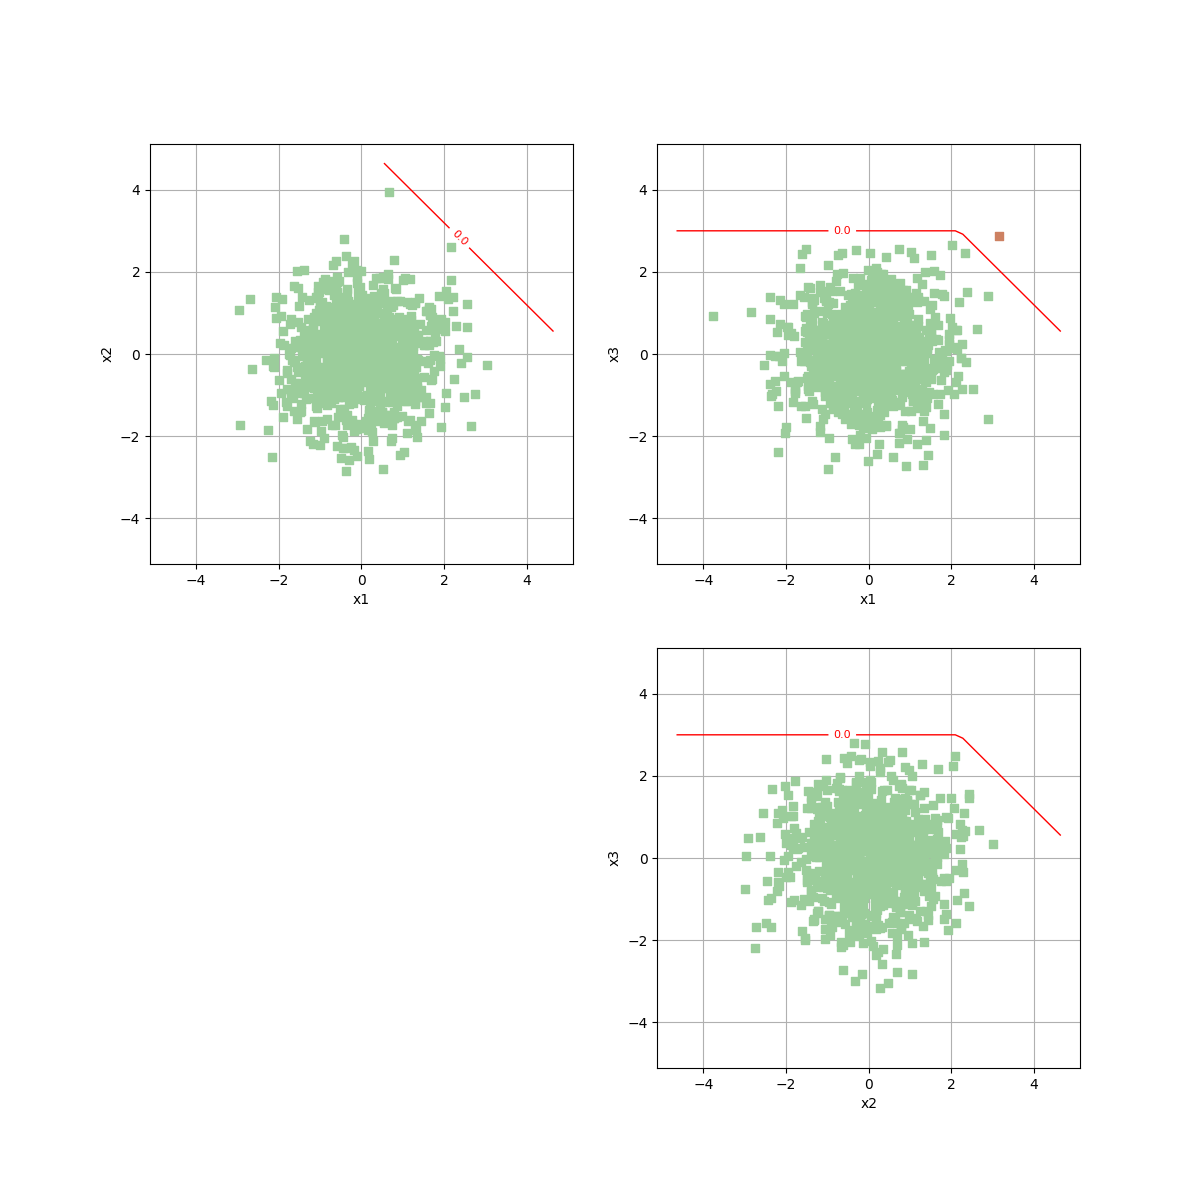
drawEvent = otb.DrawEvent(event)
The highest level method is the draw method which flags allow to gather various graphics into a single one.
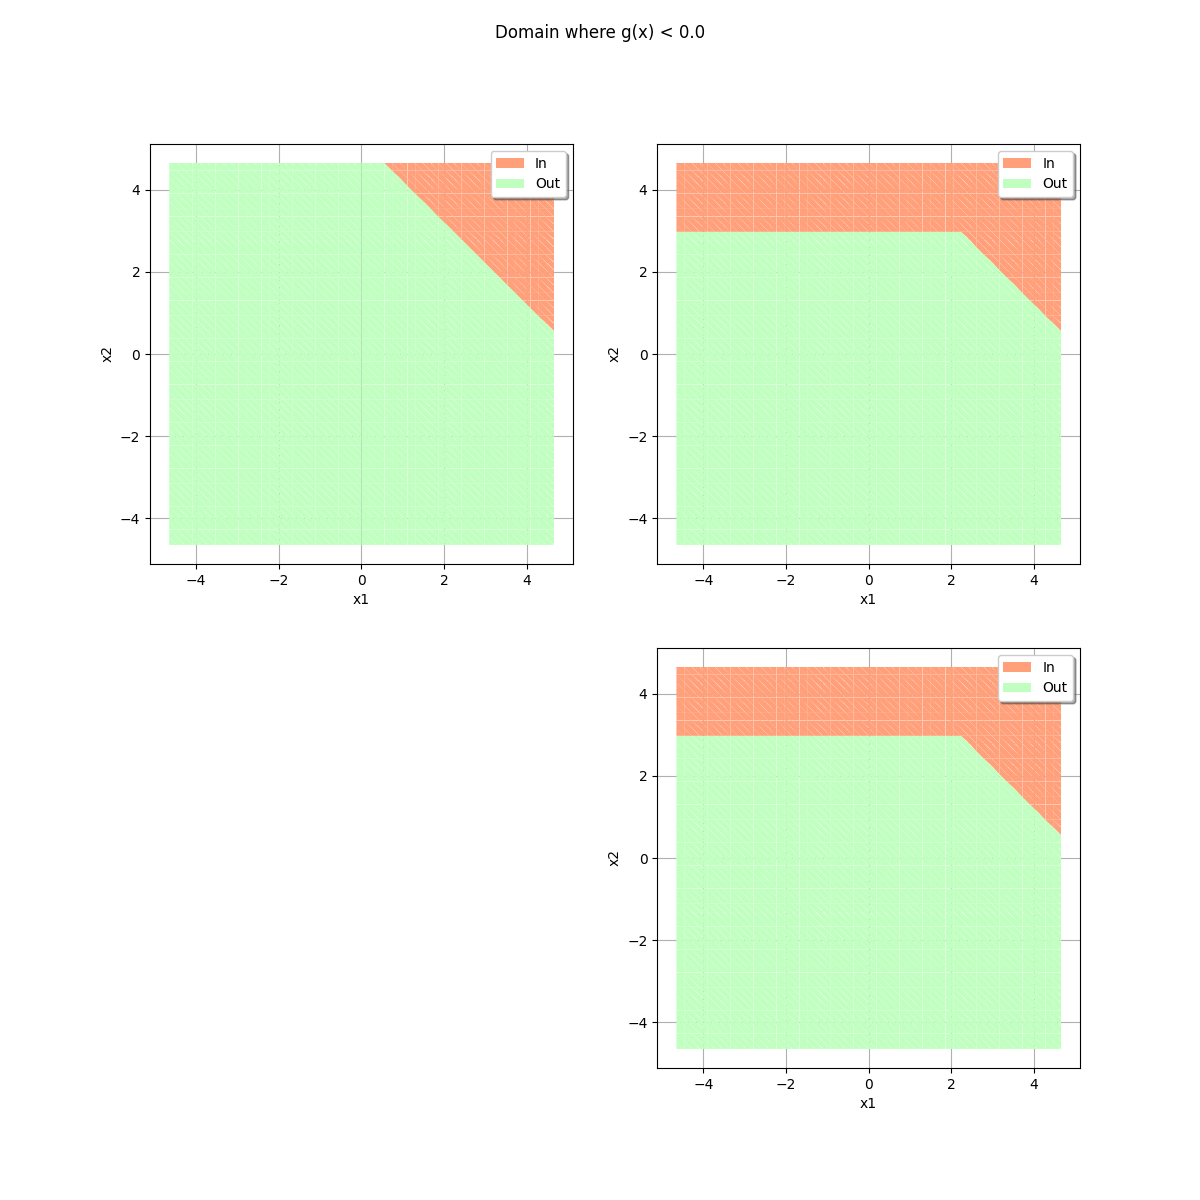
_ = drawEvent.draw(bounds)
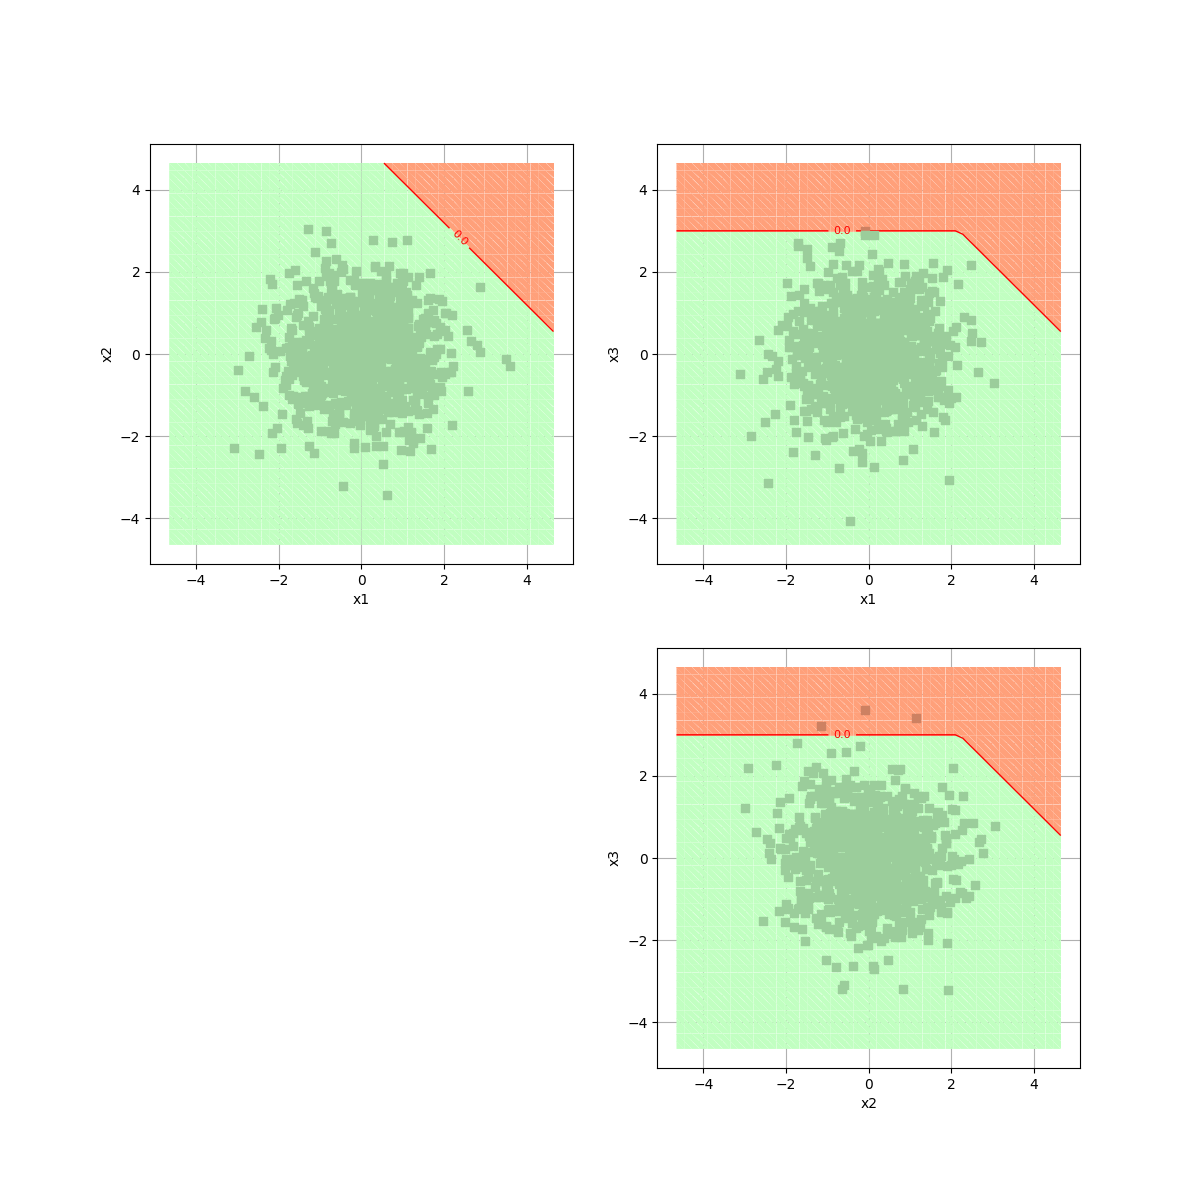
_ = drawEvent.draw(bounds, fillEvent=True)
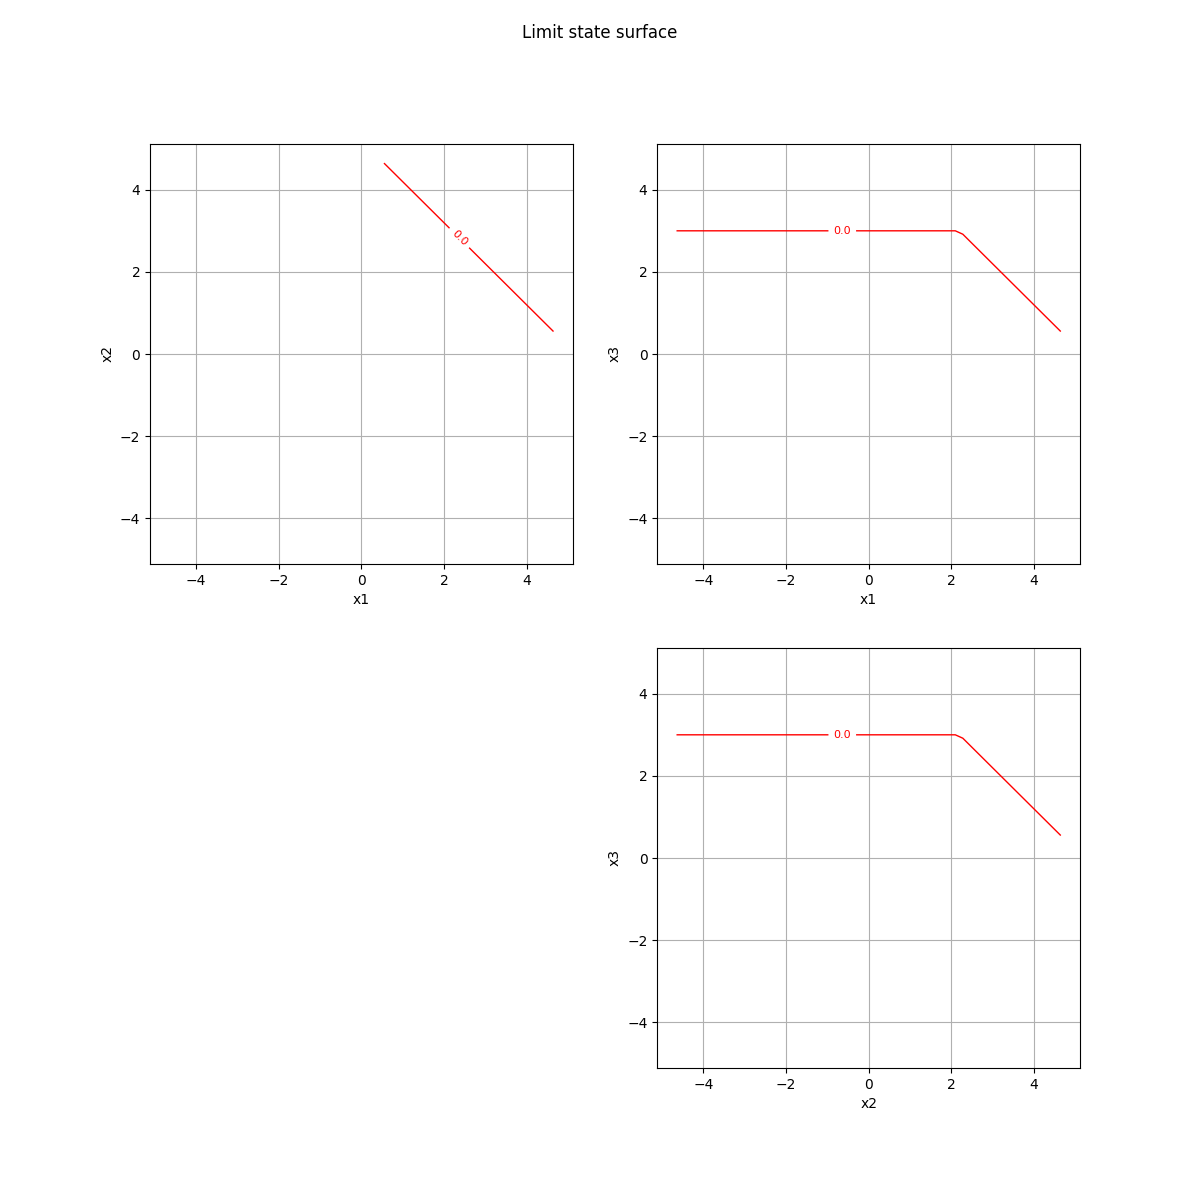
The drawLimitState method only draws the limit state.
_ = drawEvent.drawLimitState(bounds)
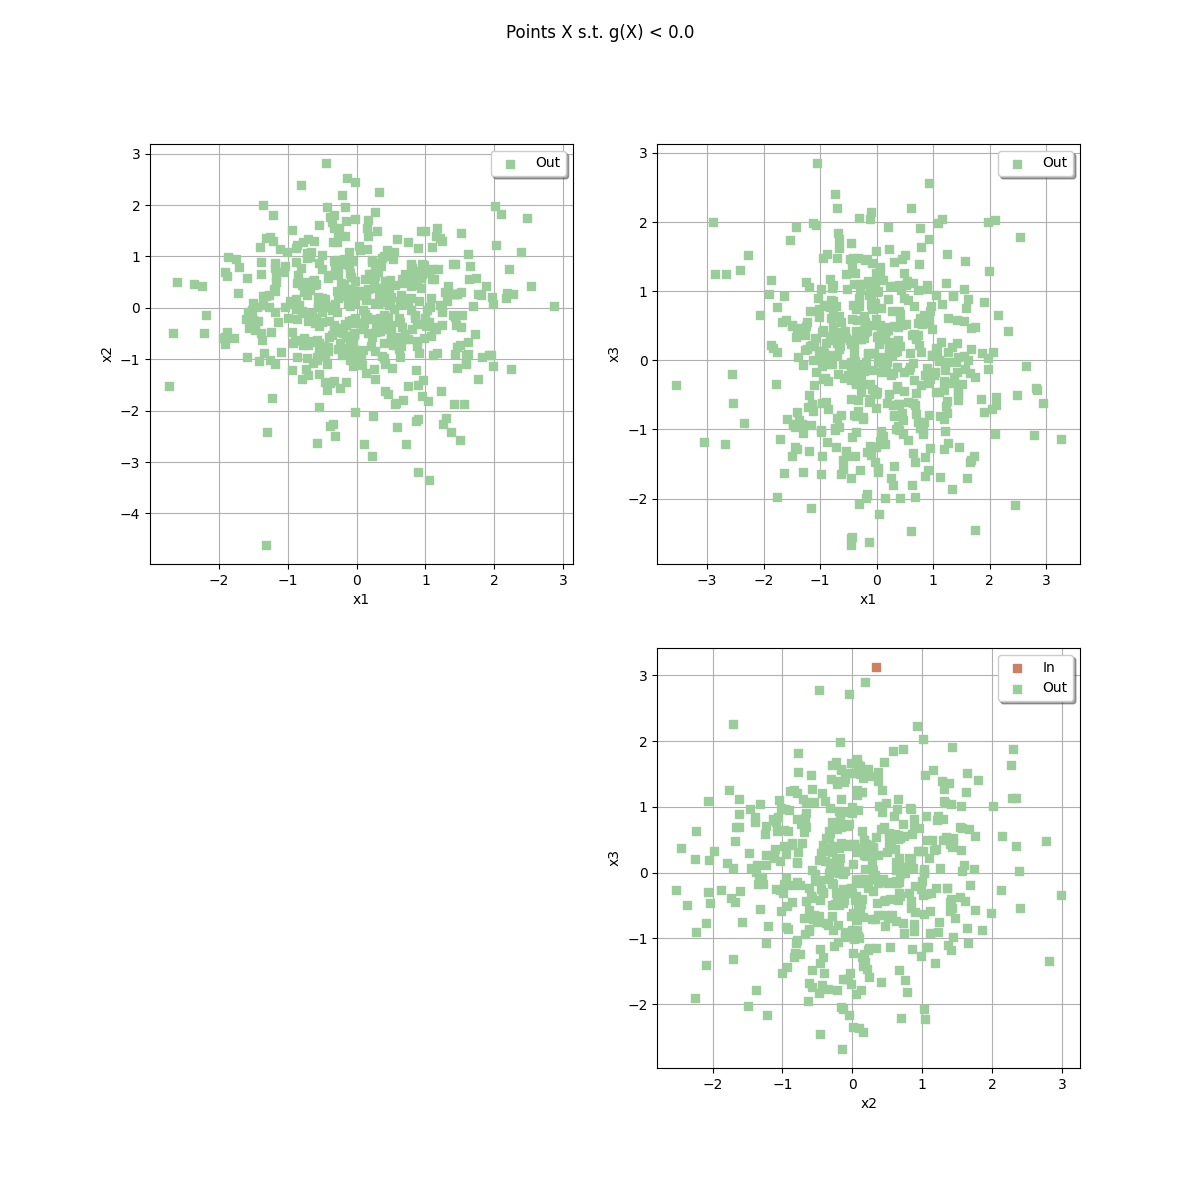
The drawSample method plots a sample with a color code which specifies which points are inside or outside the event.
sampleSize = 500
_ = drawEvent.drawSample(sampleSize)
_ = drawEvent.fillEvent(bounds)
2D problem
When the problem has 2 dimensions, single cross-cuts are sufficient. This is why we use the *CrossCut methods.
problem = otb.ReliabilityProblem22()
event = problem.getEvent()
g = event.getFunction()
inputVector = event.getAntecedent()
distribution = inputVector.getDistribution()
bounds, marginalProb = distribution.computeMinimumVolumeIntervalWithMarginalProbability(
    1.0 - 1.0e-6
)
sampleSize = 10000
drawEvent = otb.DrawEvent(event)
cloud = drawEvent.drawSampleCrossCut(sampleSize)
_ = otv.View(cloud)
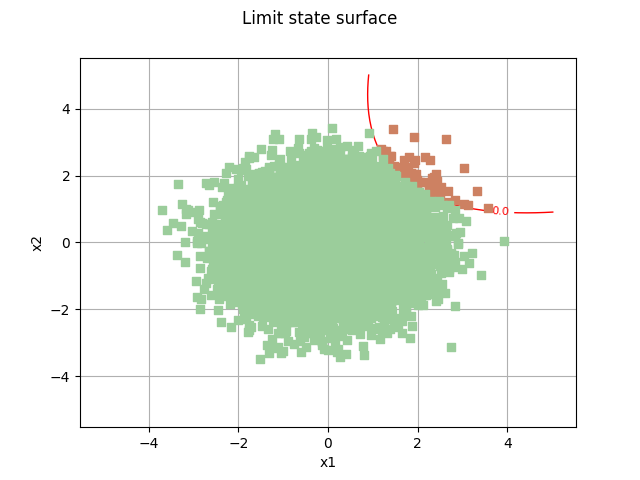
graph = drawEvent.drawLimitStateCrossCut(bounds)
graph.add(cloud)
_ = otv.View(graph)
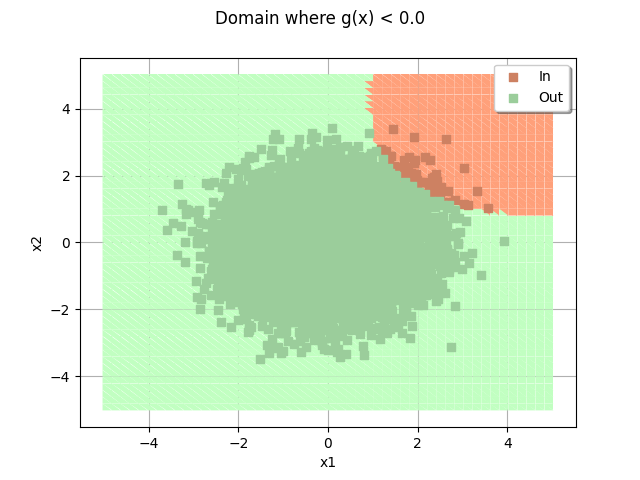
domain = drawEvent.fillEventCrossCut(bounds)
_ = otv.View(domain)
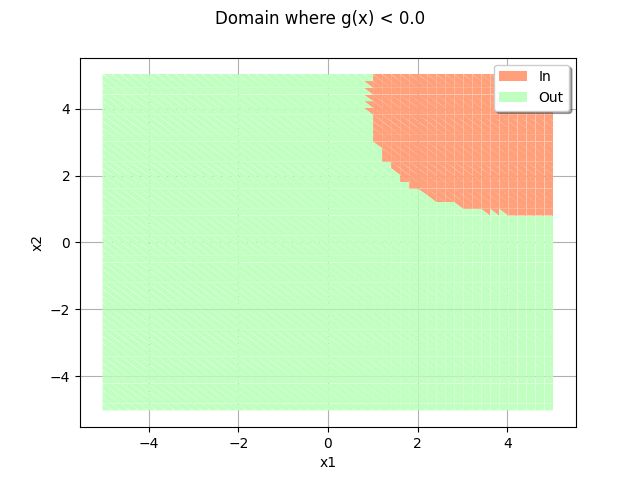
domain.add(cloud)
_ = otv.View(domain)
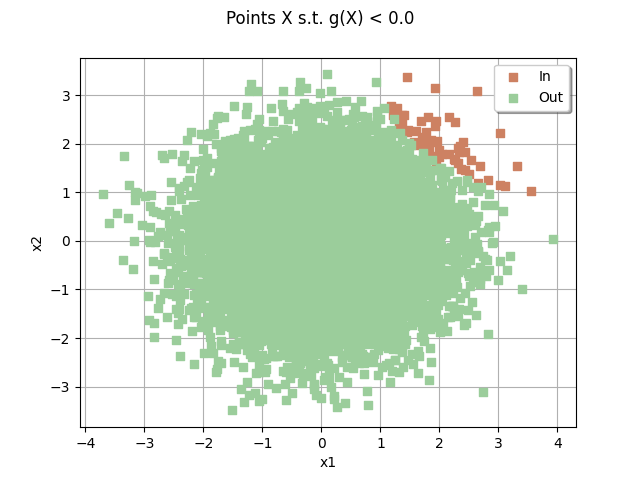
For a 2D sample, it is sometimes handy to re-use a precomputed sample. In this case, we can use the drawInputOutputSample method.
inputSample = distribution.getSample(sampleSize)
outputSample = g(inputSample)
drawEvent.drawInputOutputSample(inputSample, outputSample)
class=Graph name=Points X s.t. g(X) < 0.0 implementation=class=GraphImplementation name=Points X s.t. g(X) < 0.0 title=Points X s.t. g(X) < 0.0 xTitle=x1 yTitle=x2 axes=ON grid=ON legendposition=topright legendFontSize=10 drawables=[class=Drawable name=In implementation=class=Cloud name=In derived from class=DrawableImplementation name=In legend=In data=class=Sample name=Unnamed implementation=class=SampleImplementation name=Unnamed size=40 dimension=2 data=[[1.71237,2.85486],[1.66792,2.31783],[2.69441,1.34366],[1.86644,2.24982],[2.02031,1.92003],[1.37012,2.49056],[2.09796,1.7934],[1.51539,2.21068],[1.65414,2.24108],[2.38439,1.58069],[2.09313,1.52526],[1.88487,2.12252],[1.53307,3.17321],[3.35848,1.22148],[1.73253,2.64634],[2.53091,1.47052],[1.76564,1.90677],[2.22299,1.66299],[2.72437,1.52226],[1.87608,1.75339],[1.20151,2.79605],[1.61561,1.94388],[1.97895,2.3215],[1.45782,3.05815],[1.98593,1.87883],[2.16331,1.7884],[0.998138,3.66056],[2.15616,1.83874],[1.47851,2.3263],[2.55846,1.62646],[3.36152,1.47219],[2.65572,2.43453],[2.02096,1.72365],[1.94358,2.18157],[1.99646,2.14285],[3.05755,1.43522],[2.17683,2.15387],[1.77961,2.17732],[1.32333,3.19999],[2.03815,1.59132]] color=lightsalmon3 isColorExplicitlySet=true fillStyle=solid lineStyle=solid pointStyle=fsquare lineWidth=1,class=Drawable name=Out implementation=class=Cloud name=Out derived from class=DrawableImplementation name=Out legend=Out data=class=Sample name=Unnamed implementation=class=SampleImplementation name=Unnamed size=9960 dimension=2 data=[[-0.173501,-0.0297064],[-1.61099,1.88273],[0.280493,-1.76397],...,[-0.501814,-2.23713],[1.12524,0.218319],[-1.00681,0.0682829]] color=darkseagreen3 isColorExplicitlySet=true fillStyle=solid lineStyle=solid pointStyle=fsquare lineWidth=1]
otv.View.ShowAll()
Total running time of the script: (0 minutes 11.829 seconds)