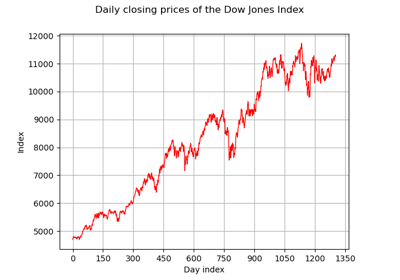
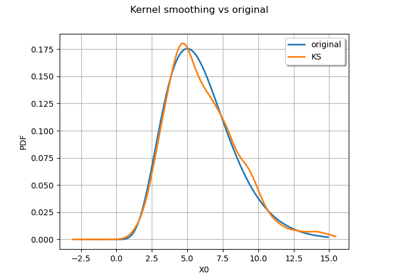
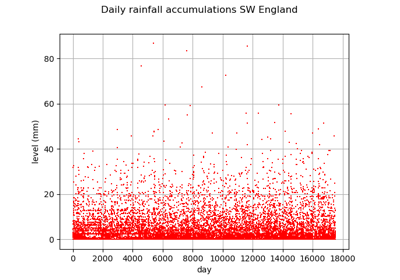
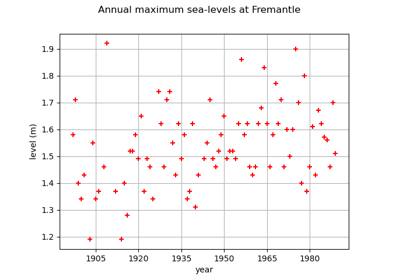
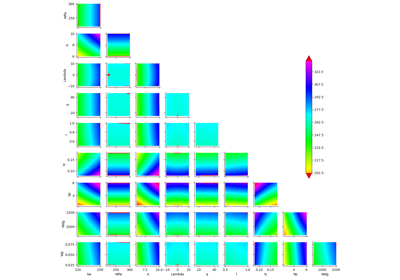
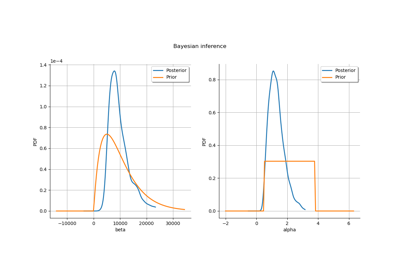
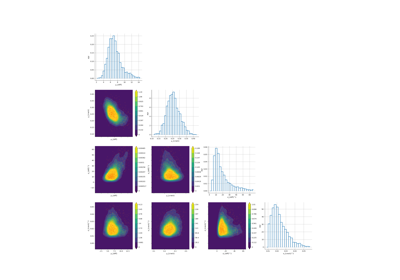
GridLayout
(Source code, png)
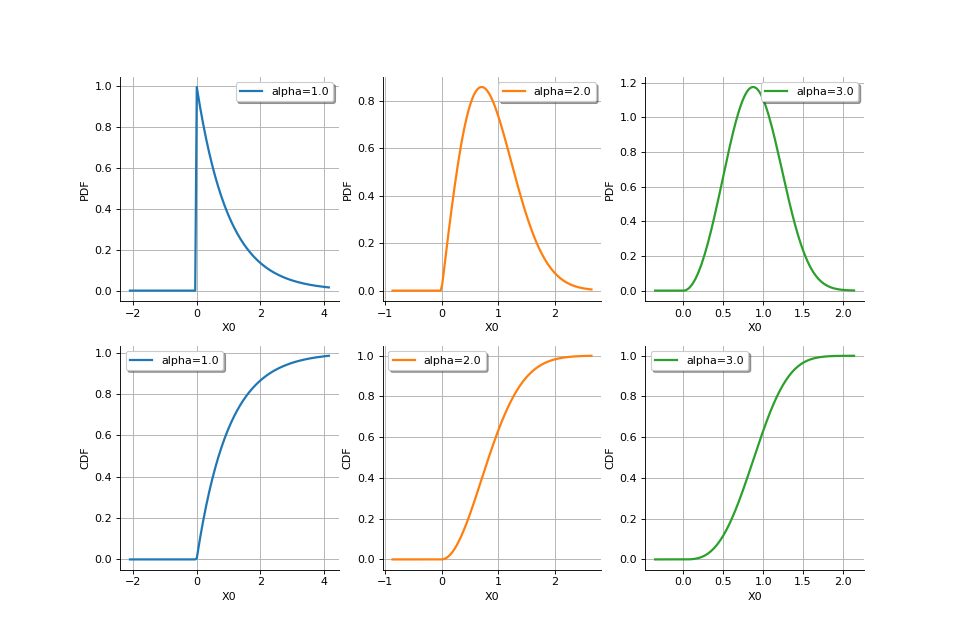
- class GridLayout(nbRows=0, nbColumns=0)
Organize subgraphs in a grid.
- Parameters:
- nb_rowsint
Number of grid rows
- nb_colsint
Number of grid columns
Methods
Accessor to the object's name.
getGraph(i, j)Subgraph accessor (grid layout only).
Accessor to the collection of graphs.
getName()Accessor to the object's name.
Column count accessor (grid layout only).
Row count accessor (grid layout only).
getTitle()Accessor to the title.
hasName()Test if the object is named.
setAxes(showAxes)Accessor to the indication of axes' presence on the Graph.
setGraph(i, j, elt)Subgraph accessor (grid layout only).
setGraphCollection(coll)Accessor to the collection of graphs.
setLayout(nbRows, nbColumns)Accessor to the layout.
setLegendPosition(position)Accessor to the legend's position of the subgraphs.
setName(name)Accessor to the object's name.
setTitle(title)Accessor to the title.
Examples
>>> import openturns as ot
>>> grid = ot.GridLayout(2, 3)
>>> for j in range(grid.getNbColumns()):
...    beta = 1.0 + j
...    grid.setGraph(0, j, ot.Gumbel(beta, 0.0).drawPDF())
...    grid.setGraph(1, j, ot.Gumbel(beta, 0.0).drawCDF())
- __init__(nbRows=0, nbColumns=0)
- getClassName()
Accessor to the object’s name.
- Returns:
- class_namestr
The object class name (object.__class__.__name__).
- getGraph(i, j)
Subgraph accessor (grid layout only).
- Parameters:
- iint
Row index
- jint
Column index
- Returns:
- graph
Graph Subgraph at (i, j).
- graph
- getGraphCollection()
Accessor to the collection of graphs.
- Returns:
- collCollection of
Graph The graphs stored into the
GridLayout.
- collCollection of
- getName()
Accessor to the object’s name.
- Returns:
- namestr
The name of the object.
- getNbColumns()
Column count accessor (grid layout only).
- Returns:
- nb_rowsint
Number of grid columns.
- getNbRows()
Row count accessor (grid layout only).
- Returns:
- nb_rowsint
Number of grid rows.
- getTitle()
Accessor to the title.
- Returns:
- titlestr
Graph title.
- hasName()
Test if the object is named.
- Returns:
- hasNamebool
True if the name is not empty.
- setAxes(showAxes)
Accessor to the indication of axes’ presence on the Graph.
- Parameters:
- axesbool
True to draw the axes, False to hide the axes.
- setGraph(i, j, elt)
Subgraph accessor (grid layout only).
- Parameters:
- iint
Row index
- jint
Column index
- graph
Graph Subgraph at (i, j).
- setGraphCollection(coll)
Accessor to the collection of graphs.
- Parameters:
- collsequence of
Graph The graphs to store into the
GridLayout. The collection must have at most elements.
- collsequence of
- setLayout(nbRows, nbColumns)
Accessor to the layout.
- Parameters:
- nbRowsint
The new number of rows.
- nbColumnsint
The new number of columns.
Notes
If the new layout contains fewer graphs than the old layout, the remaining graphs are removed from the layout.
- setLegendPosition(position)
Accessor to the legend’s position of the subgraphs.
- Parameters:
- positionstr
Legend’s position used for the subgraphs contained inside the Graph.
- setName(name)
Accessor to the object’s name.
- Parameters:
- namestr
The name of the object.
- setTitle(title)
Accessor to the title.
- Parameters:
- titlestr
Graph title.
Examples using the class
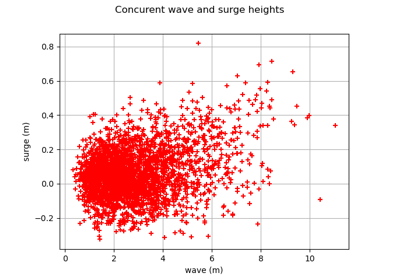
Estimate tail dependence coefficients on the wave-surge data
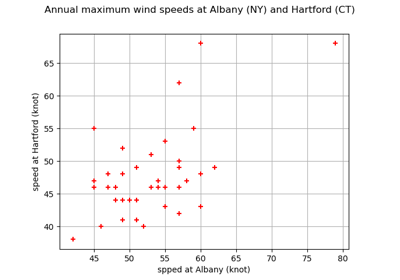
Estimate tail dependence coefficients on the wind data
Create a polynomial chaos metamodel by integration on the cantilever beam
Create a polynomial chaos for the Ishigami function: a quick start guide to polynomial chaos
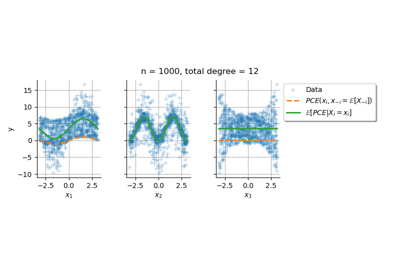
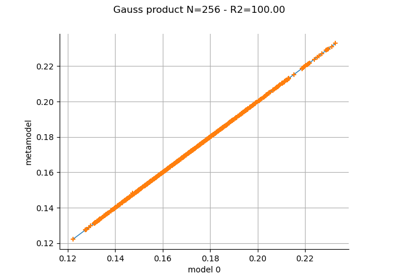
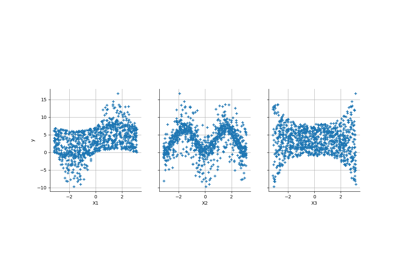
Conditional expectation of a polynomial chaos expansion
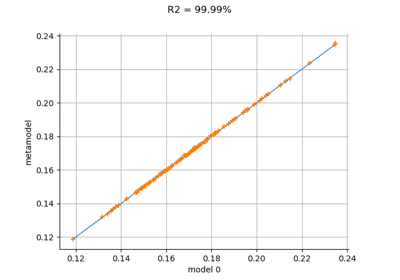
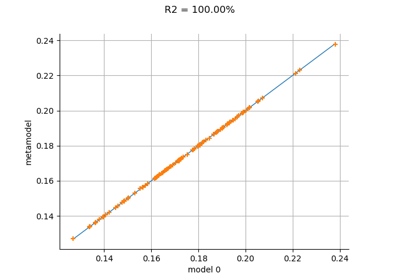
Gaussian Process Regression : cantilever beam model
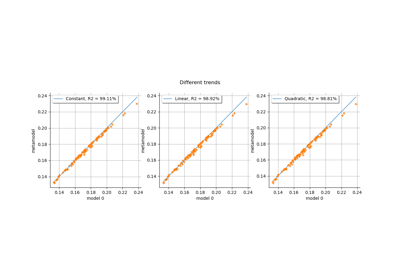
Kriging: choose a polynomial trend on the beam model
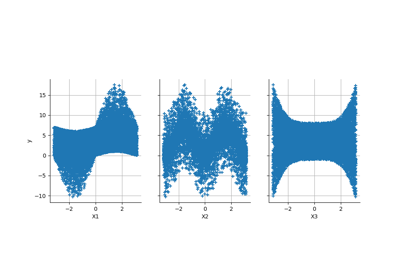
Example of sensitivity analyses on the wing weight model
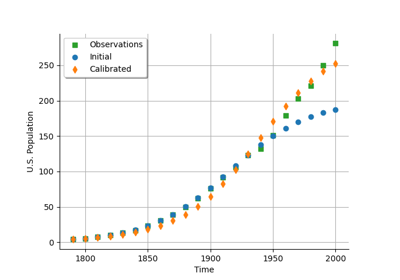
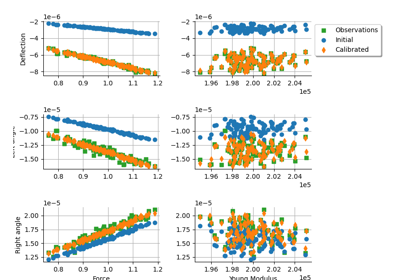
Calibrate a parametric model: a quick-start guide to calibration
Linear Regression with interval-censored observations
Bayesian calibration of hierarchical fission gas release models